Illustrations
Chapter 1: The Need for Community Planning
- Figure 1.1: Redevelopment of Regent Park in Toronto
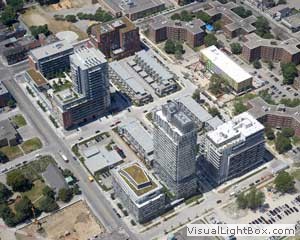
- Figure 1.2: UniverCity, Simon Fraser University, Burnaby, B.C.
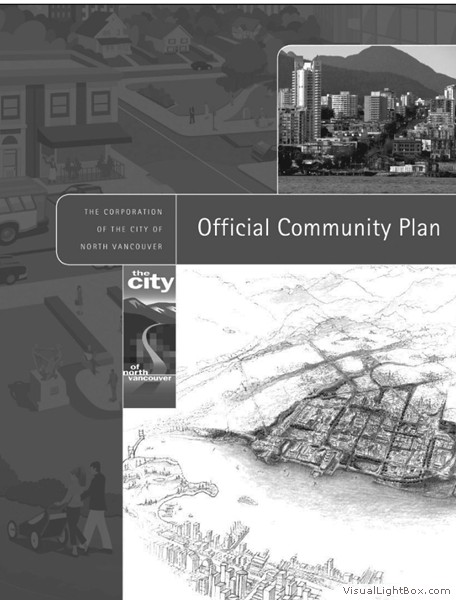
- Figure 1.3: Cover of the North Vancouver Official Community Plan, 2002
- Figure 1.4: Burnaby Social Sustainability Strategy
- Figure 1.5: Spirit Garden, Thunder Bay waterfront
This troubled 1950s public housing project was a product of the urban renewal era. After extensive consultation with the residents, a plan was developed to replace every social housing unit while adding new condominium apartments, townhouses, shops, and community facilities. New streets, parks, and community services should improve the quality of life for the residents. The plan won the 2003 National Planning Award from the Canadian Institute of Planners and may take 20 years to implement.
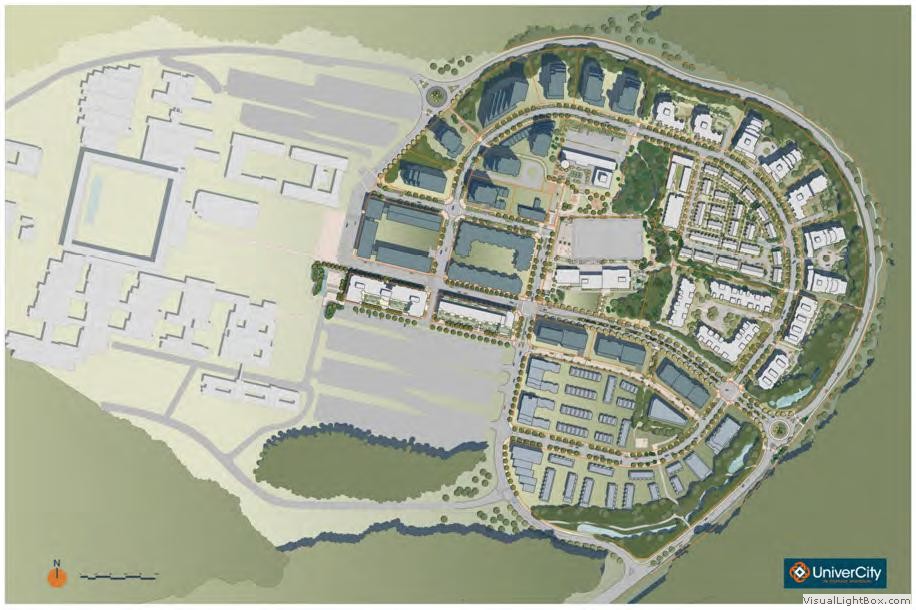
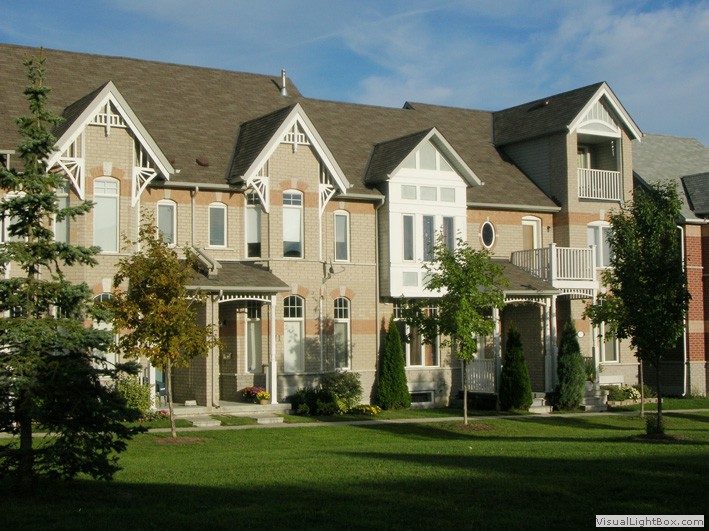
The new neighbourhood adjacent to Simon Fraser University has been designed to the highest environmental standards, incorporating best practices for buildings, infrastructure, and public spaces. UniverCity has won environmental planning awards from the CIP and the American Planning Association.

An open space on the Thunder Bay waterfront celebrating Aboriginal values and heritage in the community.(CIP 2012 Aboriginal Community Planning and Development award).
Source: Firm: Brook McIlroy, Photographer David Whittaker
Chapter 2: The Beginning of Today’s Cities
- Figure 2.1: Babylon, 6th Century BCE
- Figure 2.2: Mohenjo Daro, India, ca. 2000 BCE
- Figure 2.3: Khara-Khoto, Early Chinese Colony
- Figure 2.4: Greek City: Priene, 4th Century BCE
- Figure 2.5: Priene Streets
- Figure 2.6: Ancient Roman Garrison: Silchester, England
- Figure 2.7: The Forum in Pompeii
- Figure 2.8: 13th Century Carcassonne, France
- Figure 2.9: Florence, Italy
- Figure 2.10: Fortified German Town: New Brandenburg, 1248
- Figure 2.11: Giambattista Nolli’s Map of Rome, 1748
- Figure 2.12: 18th Century Karlsruhe, Germany
- Figure 2.13: Philadelphia: Thomas Holme’s Plan of 1682
- Figure 2.14: Savannah, Georgia: Oglethorpe’s 1734 Plan
- Figure 2.15: L’Enfant’s Plan for Washington, 1791
- Figure 2.16: Proposed Model Community of New Harmony, Indiana, by Robert Owen, 1825
- Figure 2.17: Proposed Phalanstery Model Community by Charles Fourier, 1832
- Figure 2.18: Bournville Village Green, ca. 1929
- Figure 2.19: Patrick Geddes, ca. 1886
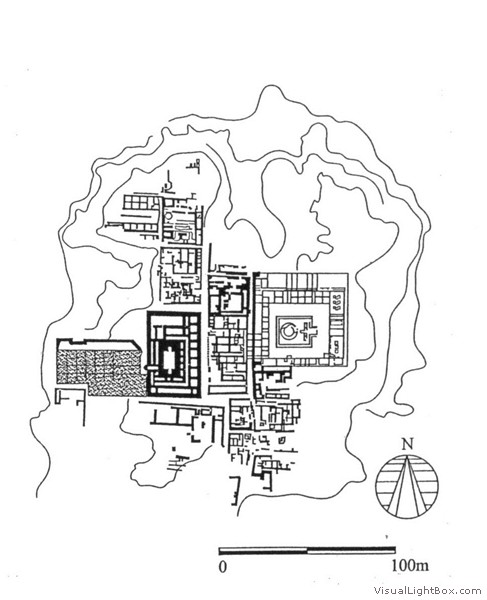
The regular geometric layout and orientation of the ancient cities of the Indus Valley are probably the earliest examples of deliberate urban planning for an entire community. Both the citadel, shown here, and the lower town were based on a grid of streets aligned north – south, probably for religious reasons.
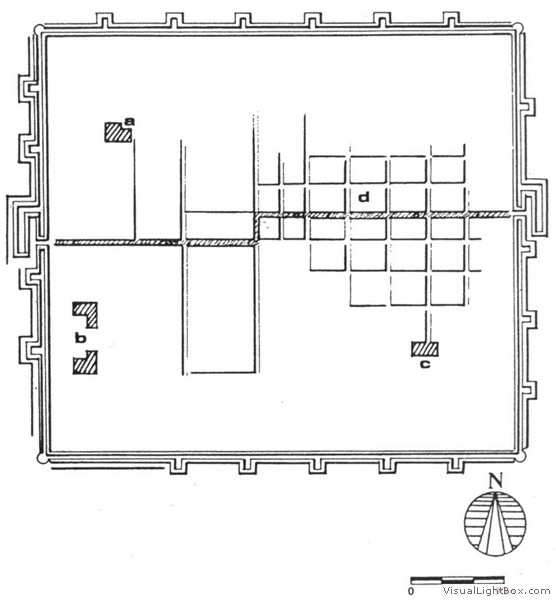
This “planted town” in Central Asia employs the planning geometry used in ancient cities in China, with walls and roads oriented precisely north-south and east-west. Roads from the gates are offset to prevent evil spirits from passing through. The town walls enclosed about 0.2km2 and held a population of 4,000-5,000. Key: (a) tomb, (b) temple, (c) palace, (d) residential compounds.
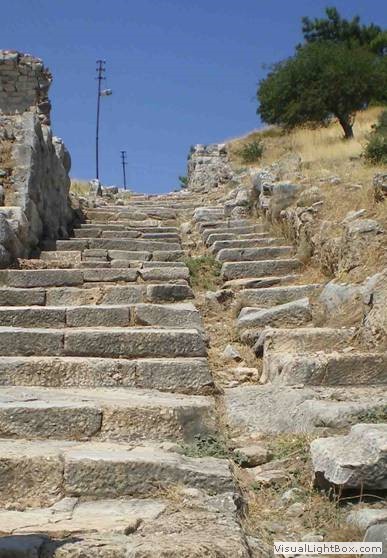
The north – south streets in Priene were stairways and the east – west streets cut across the contours to allow carts.
Source: DAVID GORDON.
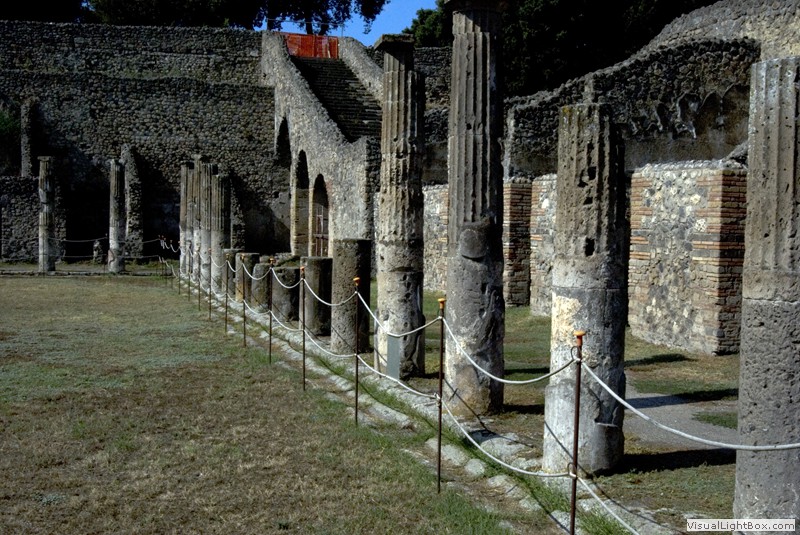
Pompeii is perhaps the most well-preserved Roman city. This forum was a place of assembly and a shopping centre.
Source: GERALD HODGE.

Florence is a classic example of a major city that grew organically, and its medieval form can still be experienced today in its central areas, despite the invasion of cars.
Source: GERALD HODGE.
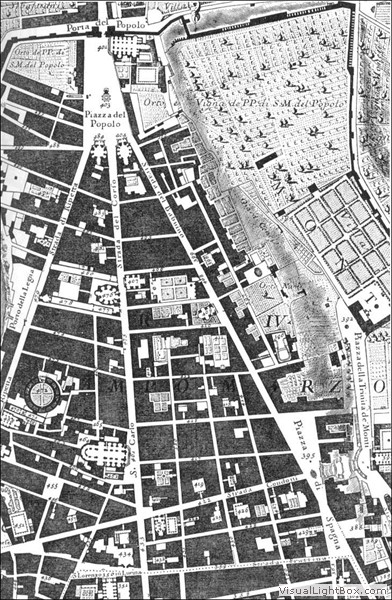
Rome had collapsed from a city of over a million people at the height of its empire to under 20 000 in the Middle Ages. Pope Sixtus V (1520 – 90) cut several straight avenues from the gates through the organic street network and marked the intersections with obelisks in the piazzas. These interventions improved navigation for the many pilgrims visiting Rome and made the layout of the city clear to visitors, a feature that is still appreciated by modern tourists. The city’s public space improvements influenced future city designers.
Source: Karte Des Nördlichen Roms Quelle: La Nuova Topografia Di Roma Comasco Von Giambattista Nolli, Ca. 1692 – 1756.
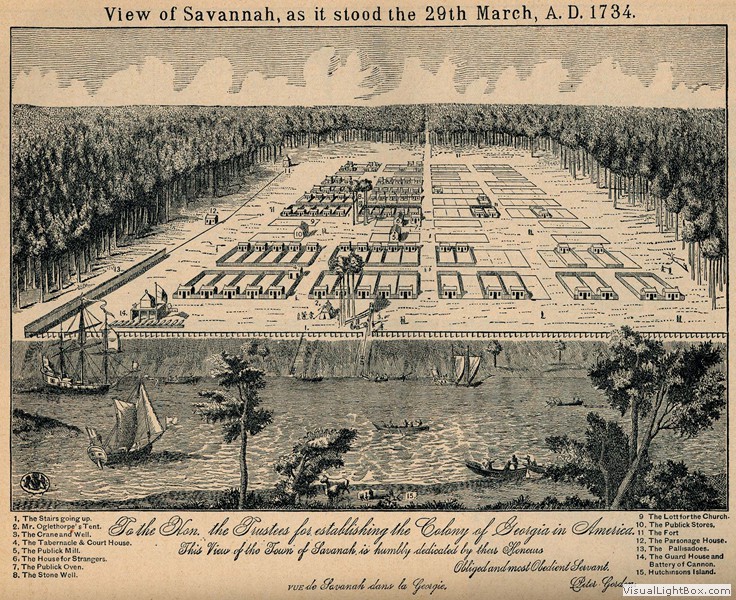
James Oglethorpe’s plan for Savannah was the basis for the expansion of the city for over a century. Its squares form the structure of the city’s charming downtown neighbourhoods.
Source: SAVANNAH 1734 BIRD’S EYE VIEW, PETER GORDON (1876). US LIBRARY OF CONGRESS/97683565.
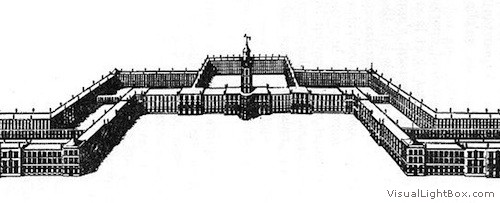
This illustration was reprinted in the title page of Fourier’s influential 1832 booklet.
Source: La Phalange: journal de la science sociale, 1832.
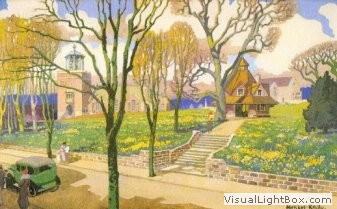
This illustration of the Bournville Village Green was reprinted in a 1931 promotional booklet. The generous public spaces and landscape had matured into a model town.
Source: Bournville Village TRUST.
Chapter 3: Nineteenth Century Foundations of Canadian Communities
- Figure 3.1: Aboriginal Settlements in Central and Western North America
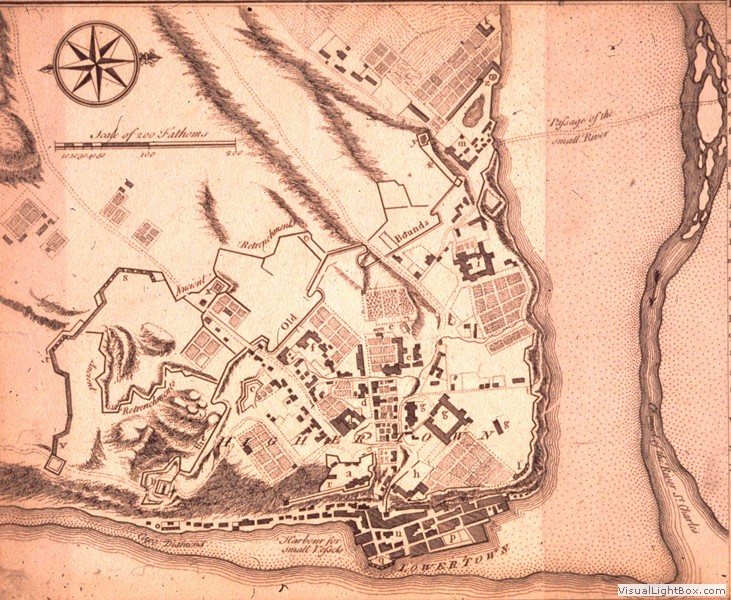
- Figure 3.2: Ville de Québec Plan, 1764
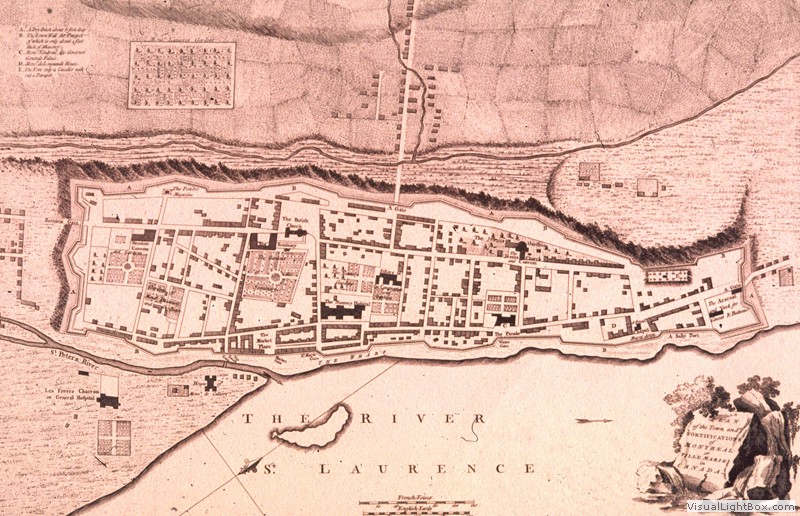
- Figure 3.3: Old Montréal Plan, 1758
- Figure 3.4: Two of the First Canadian Planned Towns, 1667
- Figure 3.5: Louisbourg, Cape Breton Island, 1720
- Figure 3.6: Charlottetown, 1771, by Thomas Wright
- Figure 3.7: Lord Dorchester’s Model Township Plan, 1789
- Figure 3.8: Original Plan for Toronto, 1788
- Figure 3.9: Canada Company Town Plans
- Figure 3.10: New Chaplin, Saskatchewan, 1907
- Figure 3.11: Fires in Early Cities – Ottawa, 1900
- Figure 3.12: Canadian Slum Housing, 1912
- Figure 3.13: Diamond Court, Montréal, ca. 1895
- Figure 3.14: Impact of Railways on the Centre of the City: Toronto, 1870
- Figure 3.15: Effect of Transportation Modes on the Form of the City: Toronto
- Figure 3.16: Evolution of Community-Planning Ideas, 1890-1900
- Figure 3.17: Chicago World’s Columbian Exposition, 1893, Court of Honour at entrance
- Figure 3.18: Chicago 1908 Plan
- Figure 3.19: Daniel Burnham
- Figure 3.20: Edward Bennett
- Figure 3.21: Garden City Diagram
- Figure 3.22: Welwyn Garden City Plan, 1922
- Figure 3.23: Ebenezer Howard Portrait
- Figure 3.24: The Three Magnets
- Figure 3.26: Mount Royal Park, Montréal, 1877, design by Frederick Law Olmsted
- Figure 3.27: Frederick Law Olmsted
- Figure 3.28: Water Delivery in Ottawa, 1870s
- Figure 3.29: Horse-Car Stuck in the Mud in Ottawa’s Sparks Street, ca. 1877
- Figure 3.30: Inaugural Run of Ottawa’s Electric Streetcar, 1891
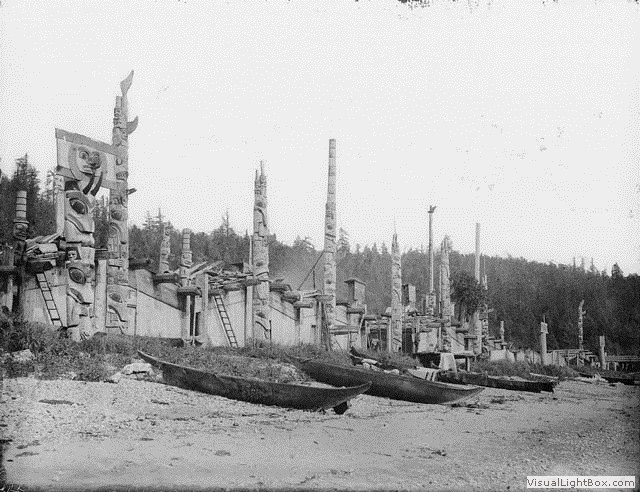
Skidegate Village of the Haida Nation in the Queen Charlotte Islands, 1878.
Source: Library and Archives Canada PA – 037756 G. Dawson photograph.
Source: Authors’ collection.
Source: Authors’ collection.
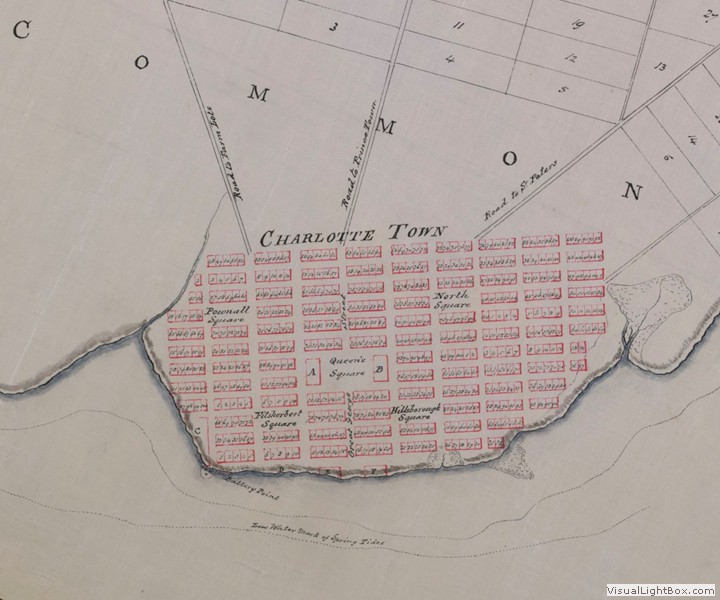
The first British colonial towns in Canada featured a regular gridiron of blocks divided into individual building lots for settlers. The grid typically started from a survey baseline along the harbour. The small blocks in Charlottetown’s original waterfront grid have retained their historic ambience and charm. In this early map, note the central square and four neighbourhood squares, similar to the Philadelphia plan. The original town site was surrounded by commonland, which provided room for future expansion and defense works.
Source:Library and Archives Canada, NMC 34291.
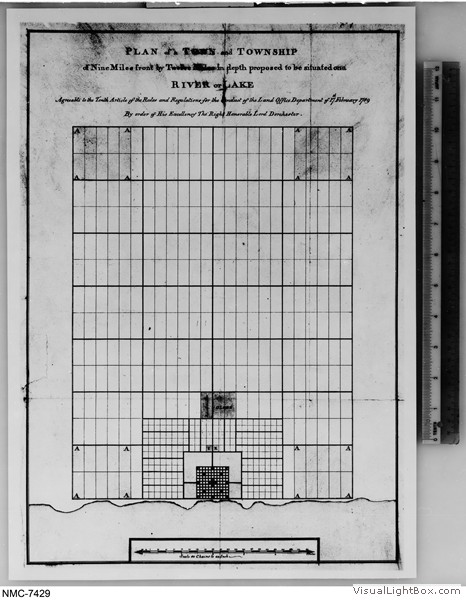
This demonstration plan for a town situated on a river or lake incorporated Canada’s first town planning regulations. The ring of empty space surrounding the town was to be a military reserve, and the large lots immediately beyond were “park lots” for the country estates of favoured settlers.
Source: Library and Archives Canada, NMC 7427.
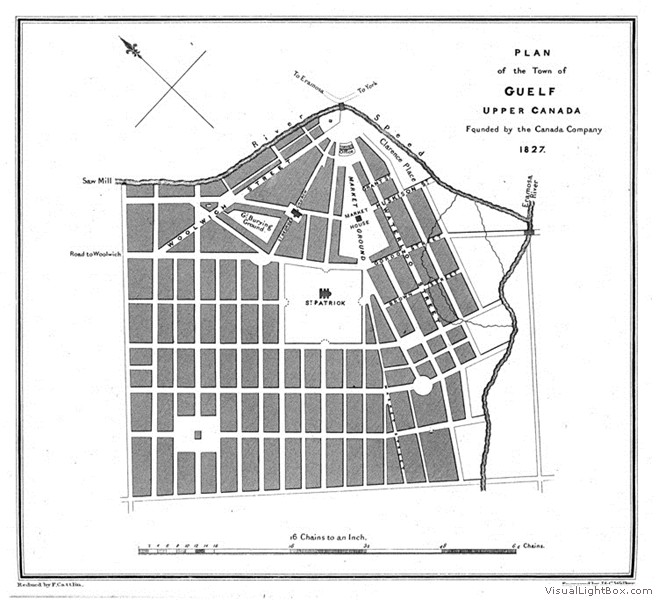
Guelph and Goderich (shown next slide) were planned by John Galt for the Canada Company to encourage settlement in western Ontario, Guelph shows the influence of the radial street pattern used in the plan for Washington DC; note the central church and wedge-shaped market. The octagonal central market square in Goderich is now occupied by the courthouse.
Source: Joseph Bouchette, The British Dominions in North America (London: Longmans, 1831).
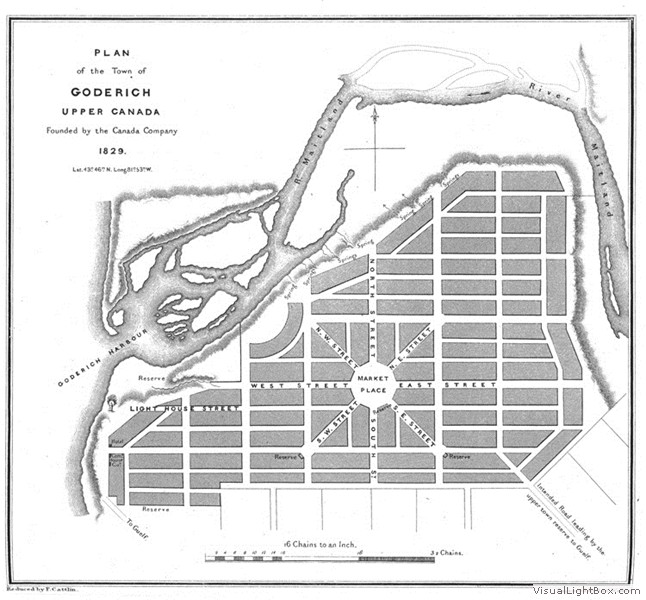
Guelph and Goderich (shown previous slide) were planned by John Galt for the Canada Company to encourage settlement in western Ontario, Guelph shows the influence of the radial street pattern used in the plan for Washington DC; note the central church and wedge-shaped market. The octagonal central market square in Goderich is now occupied by the courthouse.
Source: Joseph Bouchette, The British Dominions in North America (London: Longmans, 1831).
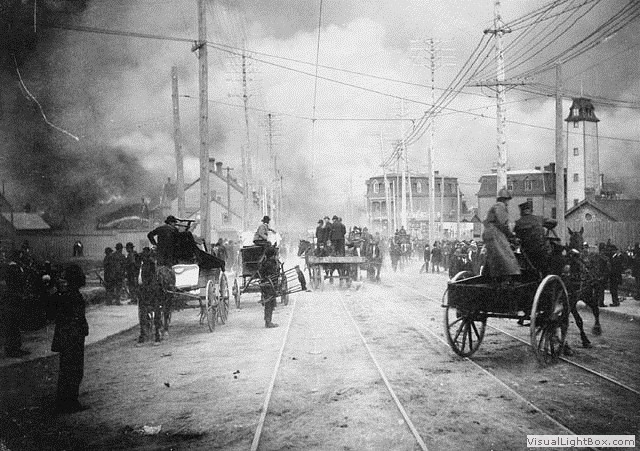
Frequent major fires occurred in Canadian cities before the introduction of adequate public water supply systems and firefighting equipment in the early years of the 20th century. These residents fled a fire that destroyed half of Hull, and jumped the river to burn 14% of Ottawa.
Source: Library and Archives Canada. PA 1200334

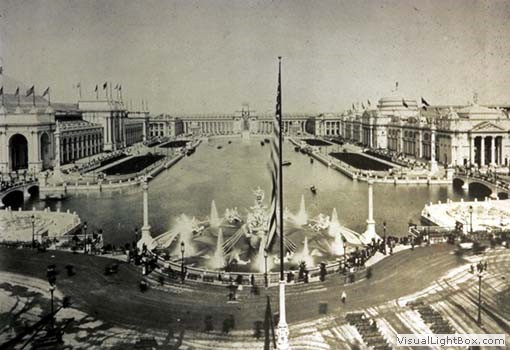
This was the first view for visitors to the Chicago World’s Fair. It left many visitors from the rather raw nineteenthcentury Canadian cities slack-jawed. Many returned home with images from souvenir booklets like this one, convinced that their cities, towns, and villages could be improved and made more beautiful.
Source: Photo by Chicago History Museum/ Getty Images.
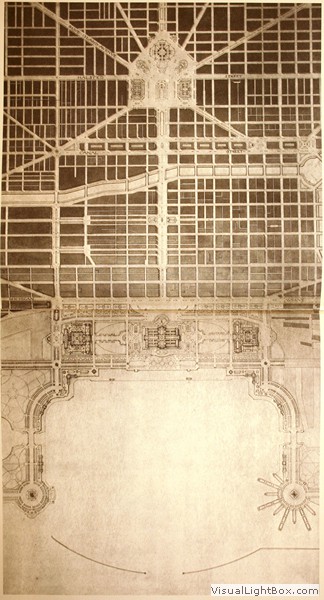
The Plan of Chicago was unveiled in 1908 as an exhibition at the Art Institute of Chicago, and then published as a beautifully bound book in 1909 and as a paperback high school civics textbook in 1910. It included far-reaching proposals such as the waterfront parks, harbour, and railway relocation shown in this plan. Most of the railway and waterfront improvements were completed in the early 20th century, but the civic centre proposed at the intersection of the diagonal avenues at the top of the plan was never built. The last section of this waterfront open space became Chicago’s Millennium Park, a century after planning for the area began.
Source: Burnham and Bennett, Plan of Chicago, 1909.
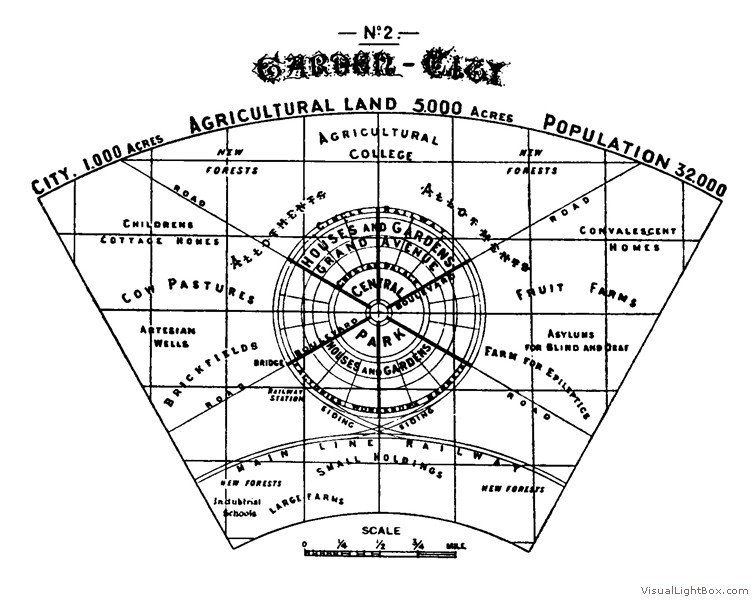
Ebenezer Howard’s diagram illustrating the principles of Garden City design. A small constellation of these satellite cities was to be established at a distance from the central city, separated by a green belt. Howard was not an architect – he made these drawings with a pencil and compass to illustrate the general principles behind his ideas.
Source: E. Howard, Garden cities of tomorrow. London, 1902; Faber, 1946 reprint. Figure 2, p. 52.
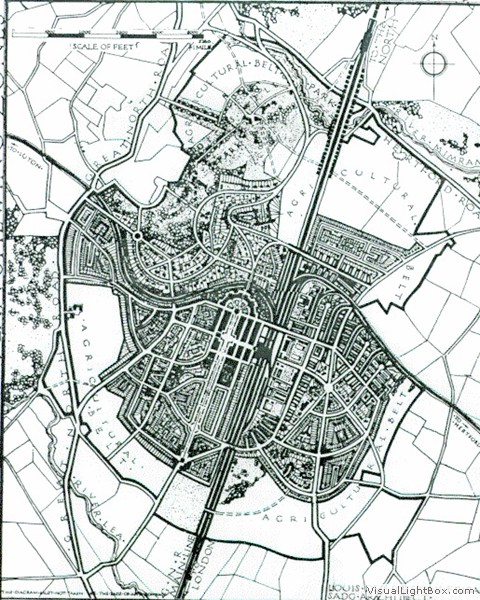
This plan by Montréal native Louis de Soissons formed the basis for development of the second Garden City at Welwyn. De Soissions was educated at Paris’s Ecole de Beaux Arts, so the plan shows more classical geometry than the organic style of Parker & Unwin at Letchworth. The town’s architecture is Georgian, rather than the Arts and Crafts style made famous at Hampstead Garden Suburb.
Source: The Print Collector/Heritage/The Image Works.
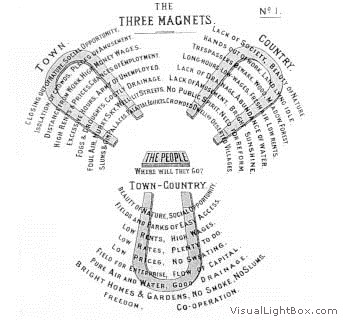
Source: E. Howard, Garden cities of TOMORROW. London, 1902; Faber, 1946 reprint.
Source: Photo by Fotosearch/Getty Images
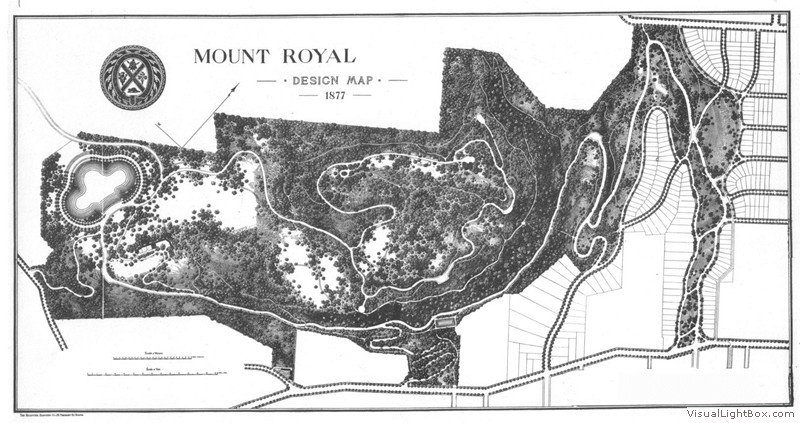
Frederick Law Olmsted’s design for Mount Royal Park, perhaps the most important Canadian plan from the Parks Movement. Olmsted’s work is now cherished and recent repairs to the park have attempted to maintain his original vision.
Source: Frederick Law Olmsted, Mount Royal, (New York: G.P. Putnam, 1881).
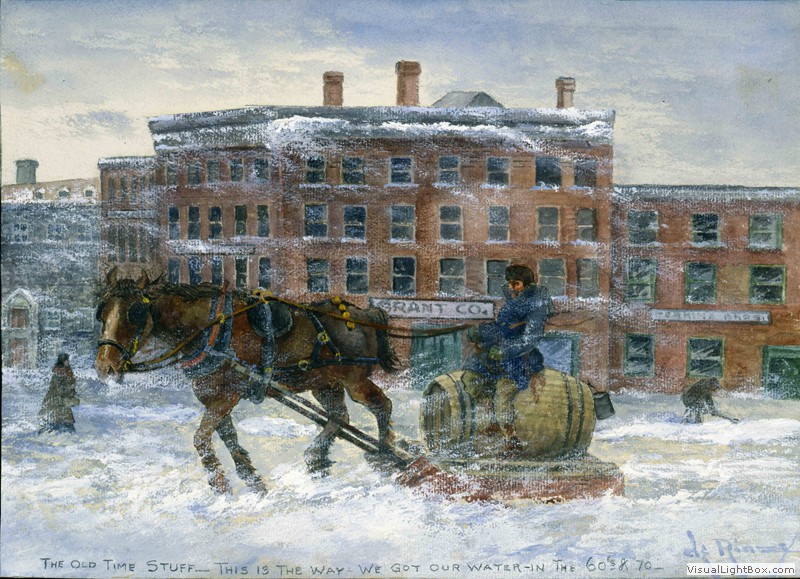
These horse-drawn barrels were barely adequate for hauling drinking water and almost useless for firefighting. The customers hoped that the pedlars filled up with the cleaner water from the river rather than from the open trenches in town. In the early days of settlement, it was probably safer to drink the beer at one of Bytown’s many taverns.
Source: Library and Archives Canada, Acc. No. 1993-343-1.
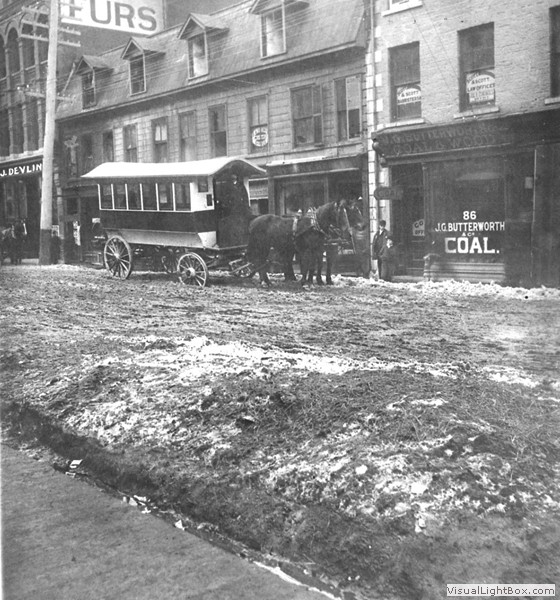
Horse-drawn streetcars were no match for the morass of mud in the streets of 19th century Canadian cities. Transit companies attached wagon wheels to their horse-cars in the spring while the rails were repaired.
Source: City of Ottawa Archives CA-1504.
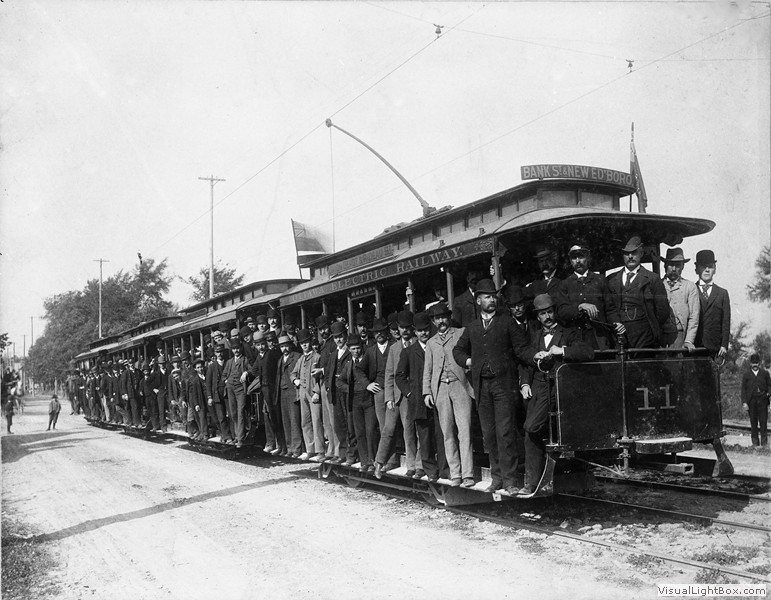
Ottawa pioneered this technology in the 19th century, led by local electrical entrepreneur Thomas Ahern. The first streetcars on steel rails were a technological breakthrough fast, smooth, quiet, and odour-free. Ironically, Ottawa fell behind other Canadian cities in reintroducing light rail in the 21st century.
Source: City of Ottawa Archives CA-1510.
Chapter 4: The Pioneering Community Planning in Canada, 1900-1950
- Figure 4.1: Excess Rural Subdivision Creating Bad Suburban Conditions in Ottawa, ca. 1914
- Figure 4.2: Excess Rural Subdivision along Streetcar Lines in Ottawa, 1915
- Figure 4.3: Evolution of Community Planning Ideas, 1900 – 1945
- Figure 4.4: City Plan for Greater Berlin (Kitchener – Waterloo, Ontario), 1914
- Figure 4.5: City Beautiful Plan for Canada’s Capital, 1915
- Figure 4.6: Thomas Mawson’s Calgary Civic Centre Plan, 1914
- Figure 4.7: Noulan Cauchon’s Hamilton Civic Centre Plan, 1917
- Figure 4.8: Morell and Nichols’ Proposed Edmonton Civic Centre Plan, 1915
- Figure 4.9: Le Corbusier
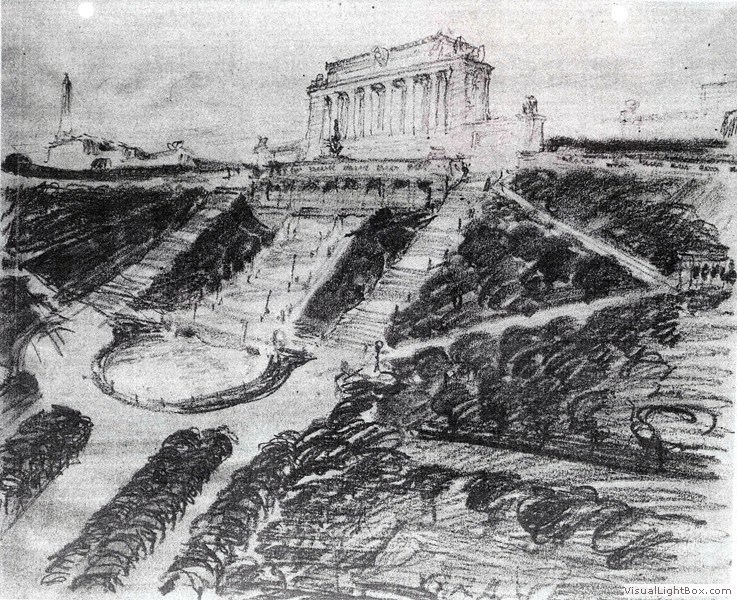
- Figure 4.11: Le Corbusier’s Plan Voisin for Central Paris, 1925
- Figure 4.12: Housing Project for Workers: Toronto, 1913
- Figure 4.13: A Garden Suburb: Shaughnessy Heights, Vancouver, Designed by Frederick Todd, 1908
- Figure 4.14&15: A Garden Suburb with Affordable Housing – The Richmond District and Hydrostone Project, Halifax
- Figure 4.16: A Garden City in the North: Temiskaming, Québec, 1917
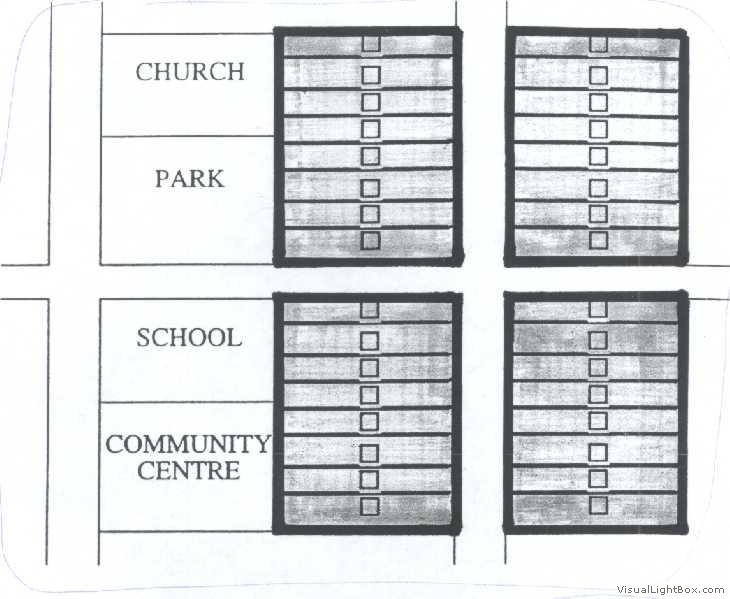
- Figure 4.17: The Neighbourhood Unit Concept, 1929
- Figure 4.18: Radburn, N.J., Clarence Stein and Henry Wright, 1928
- Figure 4.19: Kitimat, B.C., Designed by Clarence Stein
- Figure 4.20: Thomas Adams
- Figure 4.22: Noulan Cauchon
- Figure 4.23: 1912 Toronto Harbour Commissioners’ Plan
- Figure 4.24: Vancouver, B.C., Major Street Plan, 1929, by Harland Bartholomew & Assoc.
- Figure 4.25: The Vancouver Town Planning Commission, 1926
- Figure 4.26: Early Zoning Proposal: Edward Bennett’s “Land Use Districts” for Ottawa and Hull, 1915
- Figure 4.27: Lindenlea Grid vs. Garden Suburb Subdivision Design
- Figure 4.28: Early Zoning Proposal: Thomas Adams and Horace Seymour’s “Land Use Districts” for Kitchener, 1924
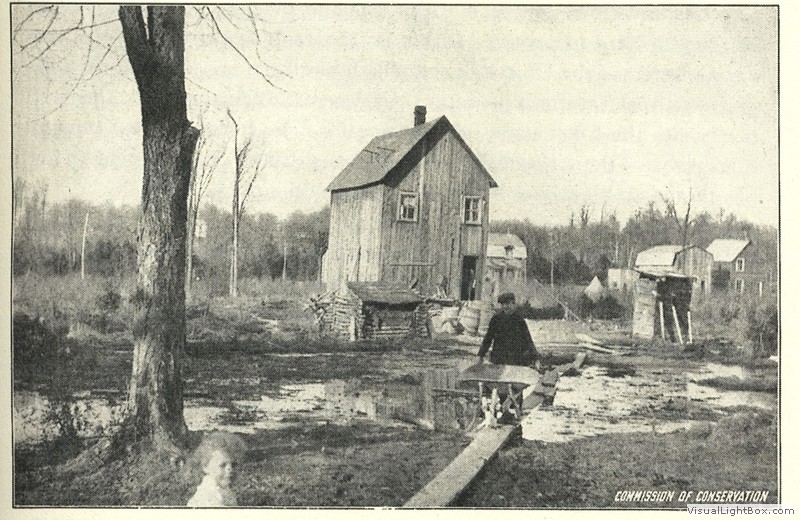
Thomas Adams described this image as “unhealthy conditions in a rural district outside Ottawa where there are hundreds of acres of fertile land lying fallow because of injurious speculation”.
Source: Thomas Adams, Rural Planning and Development, 1917, Plate XI. Photo by Commission of Conservation.

Many of the isolated subdivisions in this map were not occupied for 40 years. Thomas Adams used this drawing to highlight the problem in his 1917 book.
Source: E. H. Bennett, Report of the Federal Plan Commission for Ottawa and Hull, 1915, Figure 20A.
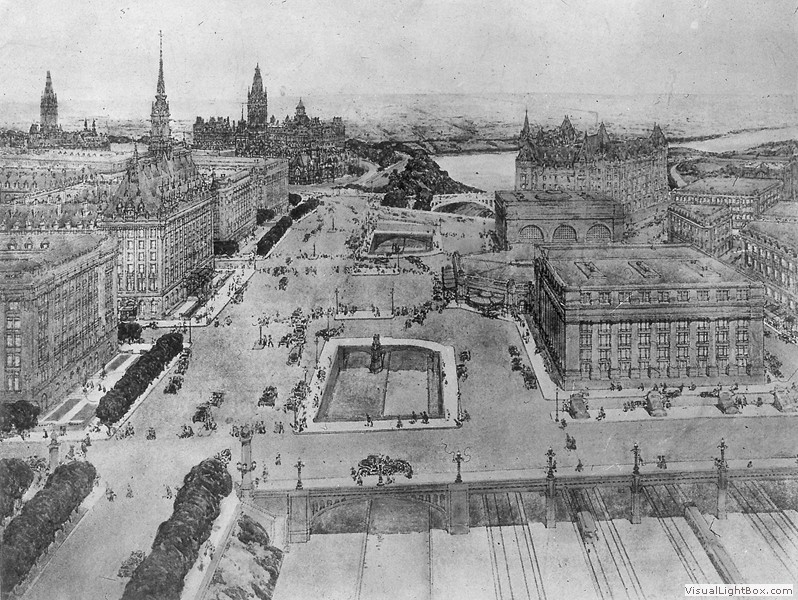
Source: H. Bennett, Report of the Federal Plan Commission for Ottawa and Hull, 1915, Figure 5; rendering by Jules Guerin.
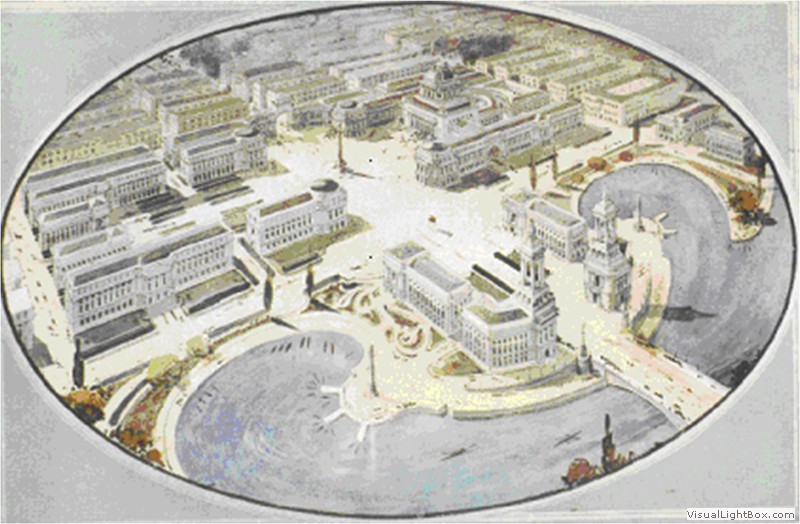
Paris comes to the Prairies, to glorify the Canadian Pacific Railway and the Hudson’s Bay Company. None of this was built, and the impracticality of some of its transportation proposals gave City Beautiful planning a bad name.
Source: T. Mawson, Calgary: Many Years Hence, 1913.
The City Beautiful is more suited to a war memorial, such as this proposal for Hamilton.
Source: Library and Archives Canada; Noulan Cauchon papers, MG 30 C 105, vol. 1.
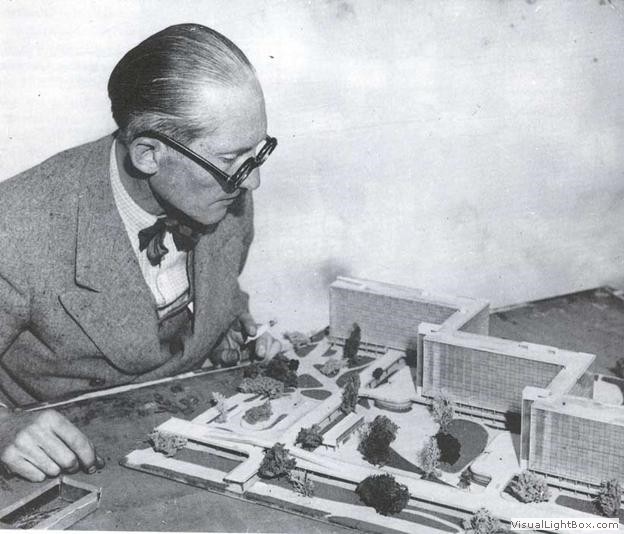
Source: AP Photo
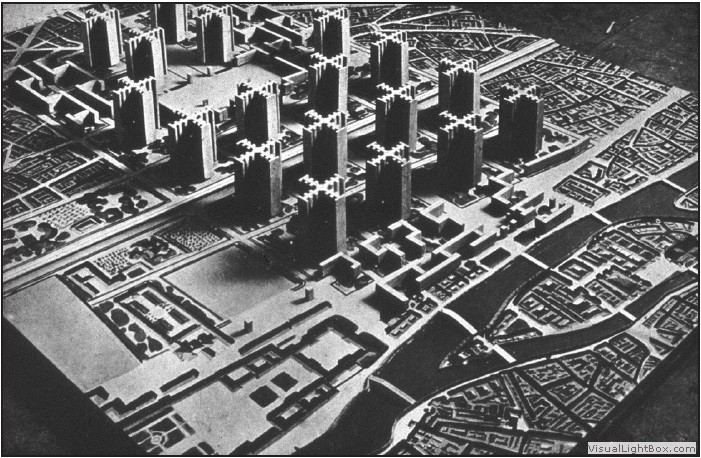
Le Corbusier proposal was to demolish the streets and buildings in central Paris, leaving only the Louvre. The vacant land was to be rebuilt with the elements of the Ville Contemporaire – tall office blocks, mid rise apartments and expressways. Paris rejected this plan, but a surprising number of cities followed the formula during the 1950s and 1960s.
Source: ã FLC (Paris)
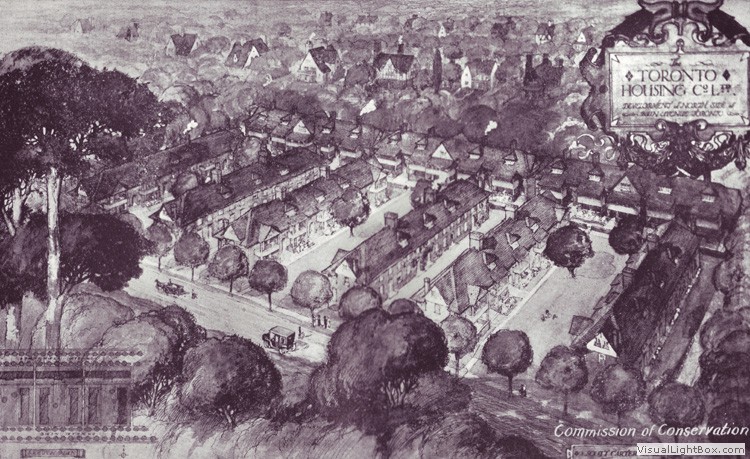
Sketch view of a housing development for working-class families. There were 204 “cottage flats” (one- to four-bedroom row houses). The Toronto Housing Company (a limited-dividend corporation) built the project, which is still in use as a non-profit housing cooperative.
Source: Commission of Conservation
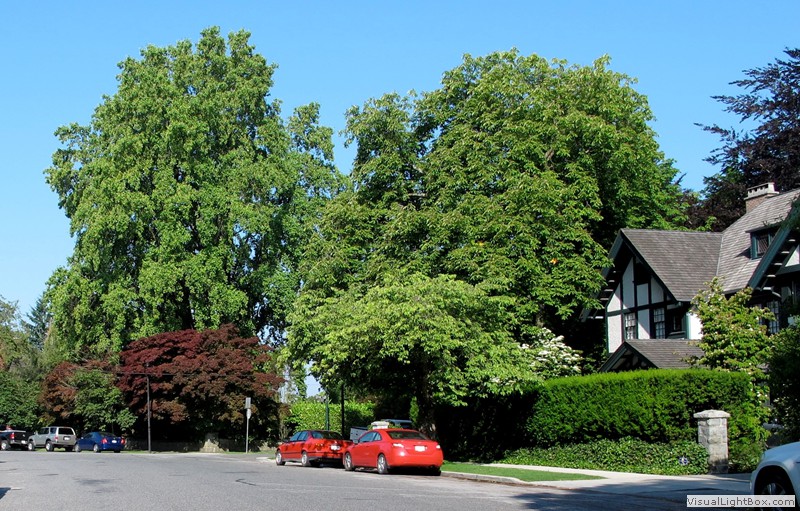
The planners of the first Garden City, Unwin and Parker, popularized this form of street layout in planning new suburbs. It was used in the design of such districts for wealthy Canadian homeowners as Mount Royal in Calgary, Leaside in Toronto, and the Town of Mont-Royal (TMR) in Montréal, as well as this one in Vancouver. Frederick Todd discarded the gridiron in favour of curving streets, which respected the hilly topography. The photo shows “The Crescent”the gracious tree-lined circular street surrounding the park in the northeast quadrant.
Source: PHOTO BY SARAH BINGHAM; REPRODUCED BY PERMISSION.
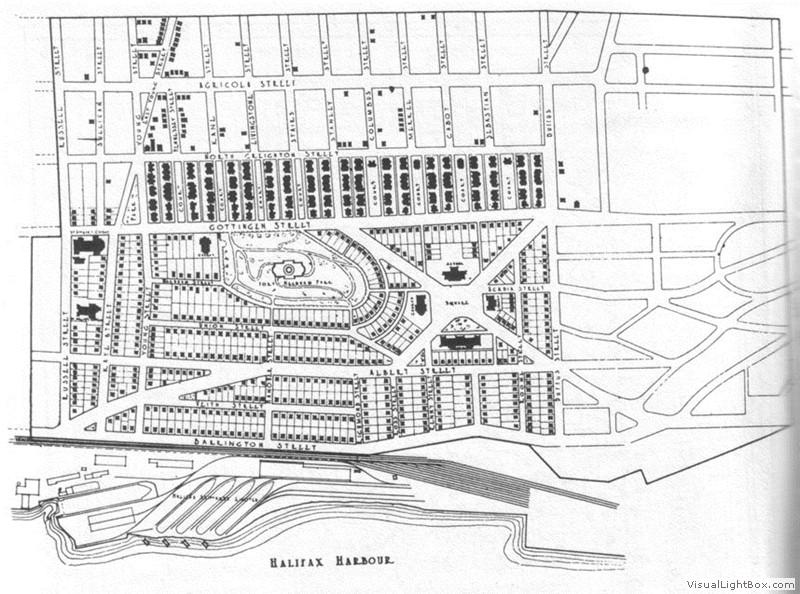
Thomas Adams’ 1917 plan for schools at the central square, and a memorial on top of the hill at the central park. The Hydrostone neighbourhood is the regular grid of short blocks, north of the park.
Source: John Sewell, The Shape of the City, (Toronto: University of Toronto Press, 1993).
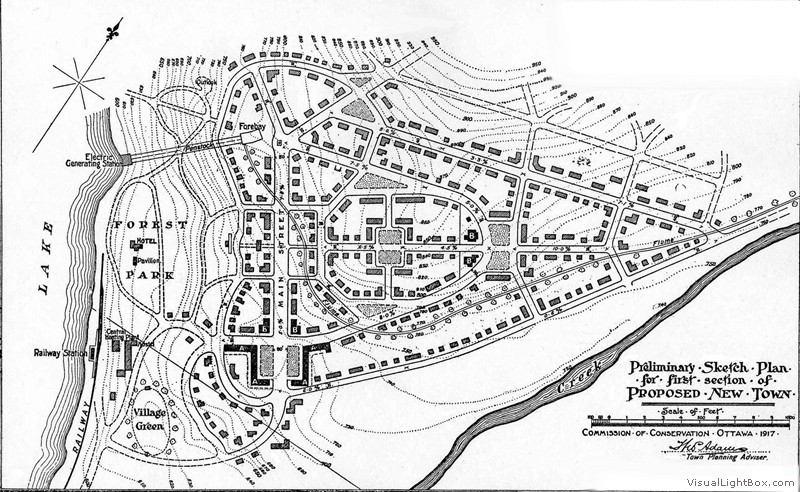
Resource producers in Canadian frontier areas have often sought to build livable communities to attract and hold their labour force. Thomas Adams was commissioned in 1917 to design this town where pulp and paper was (and still is) produced. He employed Garden City planning notions in the arrangement of streets, shops, public buildings, and parks.
Source: Thomas Adams, Rural Planning and Development, Commission of Conservation, 1917, Figure 19.
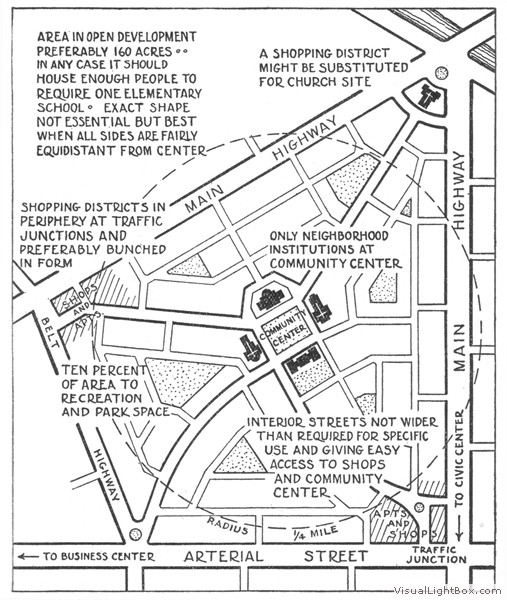
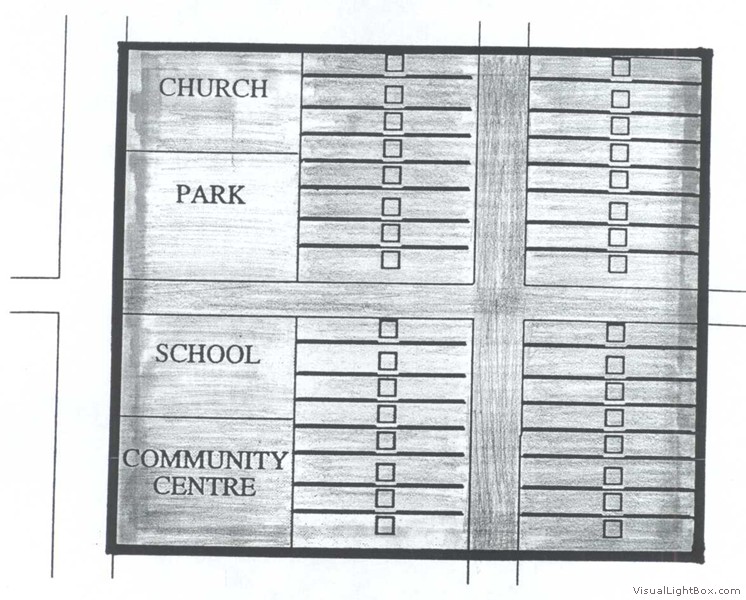
Clarence Perry’s 1929 proposals, showing the central school and park, with sites for two places of worship. Shops and apartments at the corners, and everything within a radius of a 10 minute walk.
Source: Clarence Perry, “The Neighbourhood Unit,” in Regional Survey of New York and Its Environs, Vol. 7 (New York, 1929).

One neighbourhood unit was completed before the project collapsed in the Great Depression. All the cul-de-sac back onto a park and every child can walk to the central school without crossing a street, thanks to a pedestrian underpass below the central collector road.
Source: Regional Survey for New York and Environs, Vol. 7, 1929.

Source: Library and Archives Canada, PA 177046.
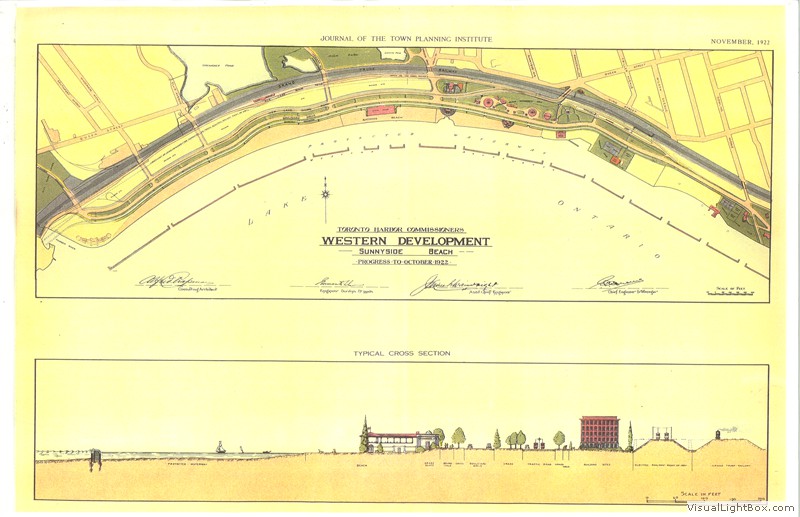
The 1912 THC plan had parks designed by the Olmsted firm, but it clearly showed its City Scientific origins with plenty of infrastructure: new harbour quays, storm sewers, and Lake Shore Boulevard, which originally resembled an elegant boulevard before it was widened to six lanes and topped with the Gardiner Expressway in the 1950s.The plan also proposed that the Don River be put into a concrete ditch and its marsh filled into industrial land. This treatment is now regarded as a major error, and Waterfront Toronto is implementing a new plan to re-naturalize the mouth of the Don.
Source: Journal of Town Planning Institute of Canada (JTPIC), November 1922; landscape by Olmsted Bros.
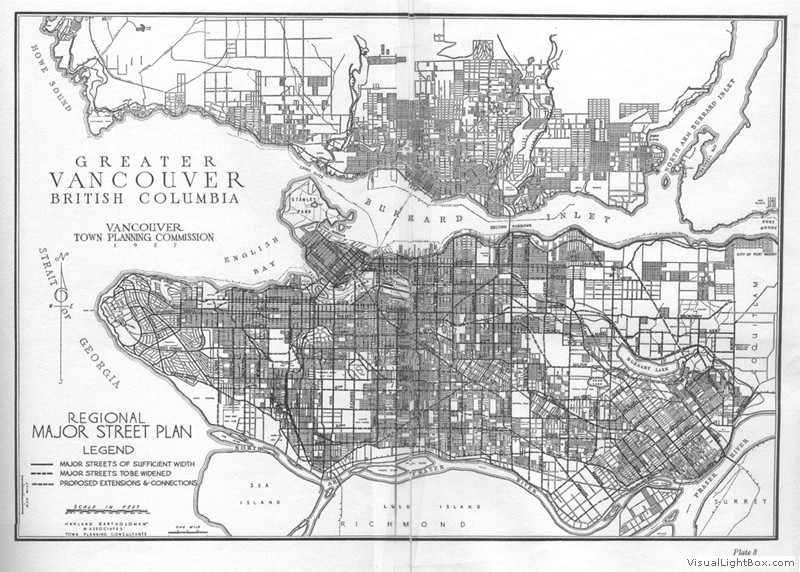
A regional roads system provided in the City Scientific style. Many of the street widenings were implemented, but the elaborate road network for the University Endowment lands at the extreme left was not.
Source: H. Bartholomew & Assoc. A Plan for the City of Vancouver, BC. (Vancouver: Vancouver Town Planning Commission 1929), plate 8.
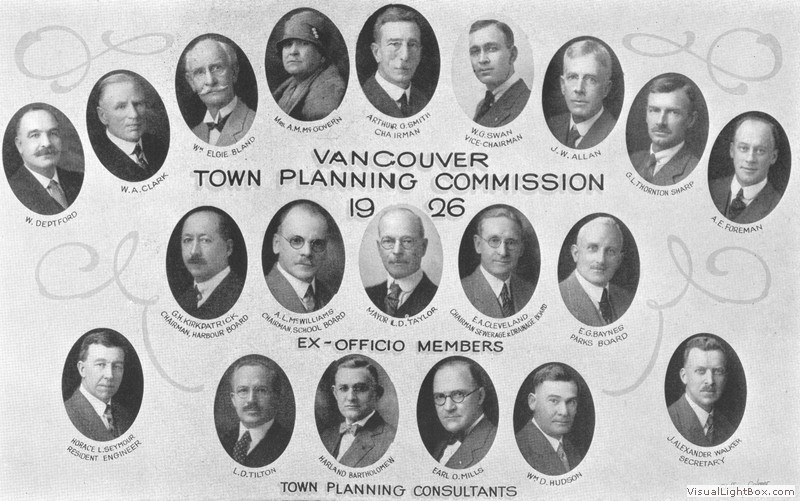
This planning commission from the Civic Reform era contained nine citizen representatives, drawn from the region’s elite, including just one woman. Ex-officio members included the Vancouver mayor and the chairs of the Parks, Harbour, Sewage & Drainage, and School Boards. They were supported by Harland Bartholomew’s town planning consultant team and Horace Seymour, Bartholomew’s “Resident Engineer” in the City Scientific tradition.
Source: H. Bartholomew & Assoc., A Plan for the City of Vancouver, B.C. (Vancouver: Vancouver Town Planning Commission 1929), Preface.
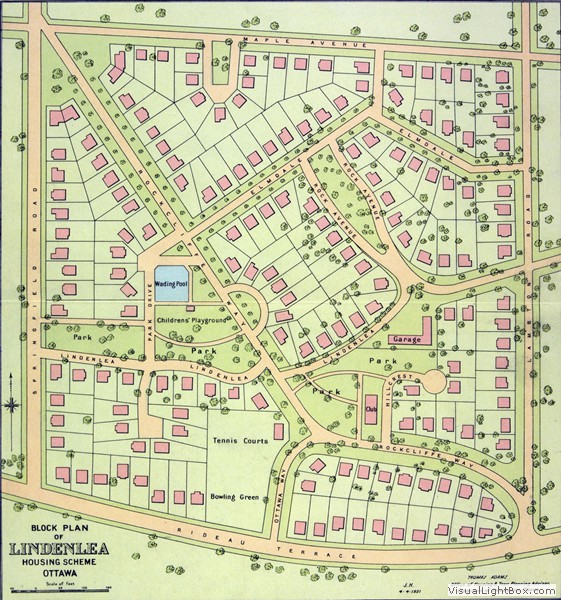
The original street and block plan for the Lindenlea area (top) placed an extension of the Ottawa street grid over the site, which included a small ridge that had precluded development for many years. Thomas Adams’s 1919 Garden Suburb subdivision design had better street grades and used the topography to create interesting open spaces. Although this was a low-cost, subsidized housing project, its good site planning gave the area lasting value.
Source (a): Map and Air Photo Library, Queen’s University, Classification no. 613.959 gnbd-1913. (b): Journal of Town Planning Institute of Canada (JTPIC), Volume 1(3), April 1921.
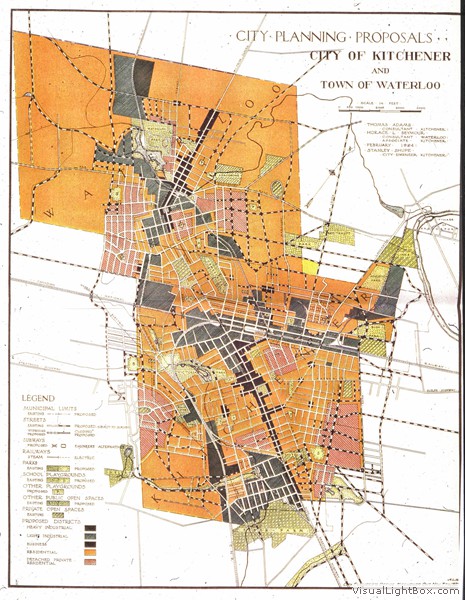
The German tradition of land use districting may also have influenced the Kitchener (formerly Berlin) citizens, who lobbied the Ontario government for authority to enact the province’s first comprehensive zoning bylaw. Adams and Seymour’s zoning plan had five simple land use districts: Heavy Industrial, Light Industrial, Business, Residential, and Detached Private Residential.
Source: Journal of Town Planning Institute of Canada (JTPIC), January 1925.
Chapter 5: Planning for the Exploding Metropolis, 1950-2000
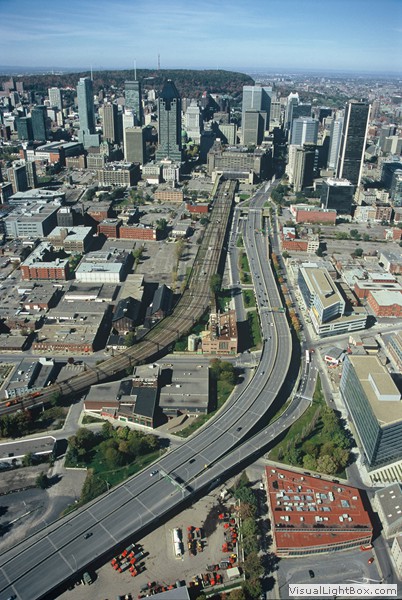
- Figure 5.1: Impact of Expressways on the Metropolitan Landscape: Longueuil, Québec
- Figure 5.2: Park Royal Shopping Centre, 1952
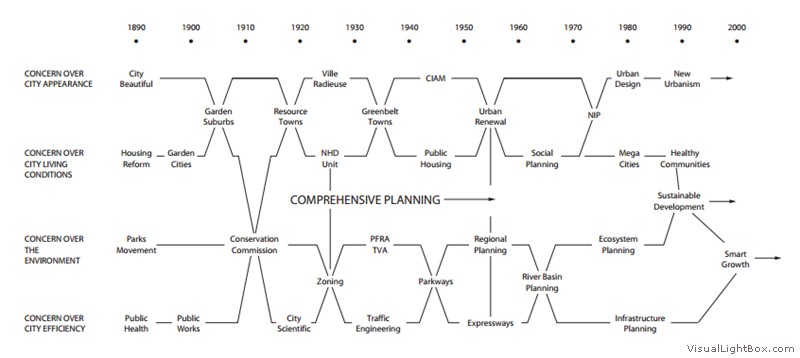
- Figure 5.3: Evolution of Canadian Planning Ideas, 1945 – 2010
- Figure 5.4: A Modern Plan for a New Capital City: Brasilia, 1957
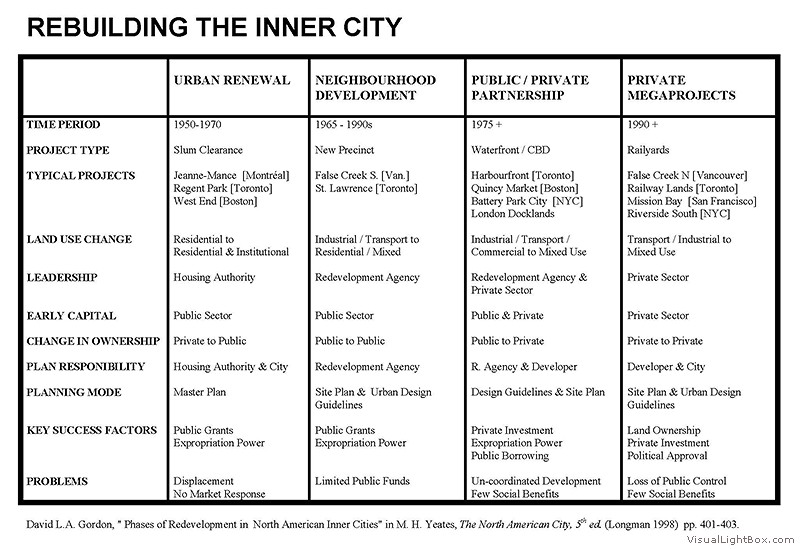
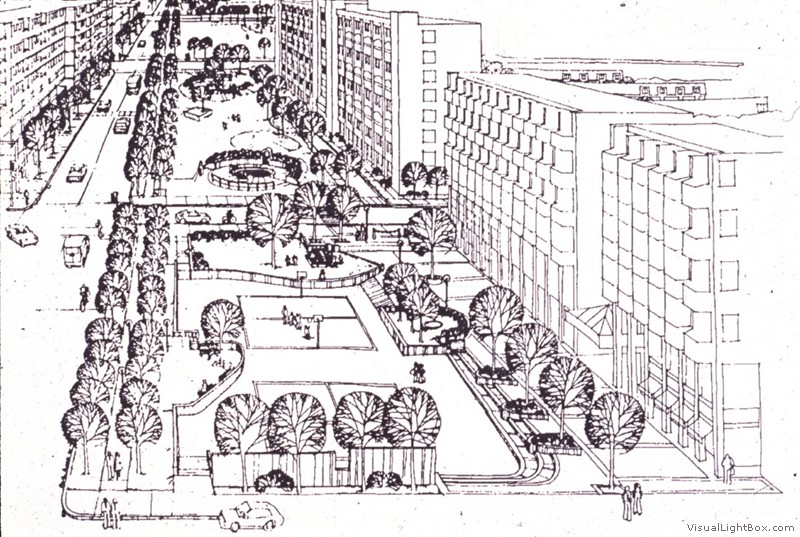
- Figure 5.5: Rebuilding the Inner City
- Figure 5.6: Regent Park North Plan, ca. 1950 5.7: St. Lawrence Neighbourhood Plan, Toronto
- Figure 5.7: St. Lawrence Neighbourhood Plan, Toronto
- Figure 5.8: False Creek South Model, ca. 1975
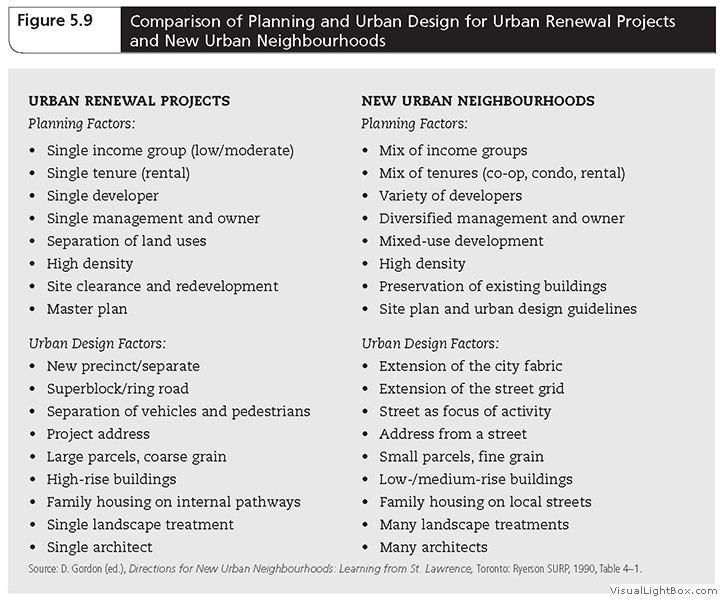
- Figure 5.9: Comparison of Planning and Urban Design for Urban Renewal Projects and New Urban Neighbourhoods
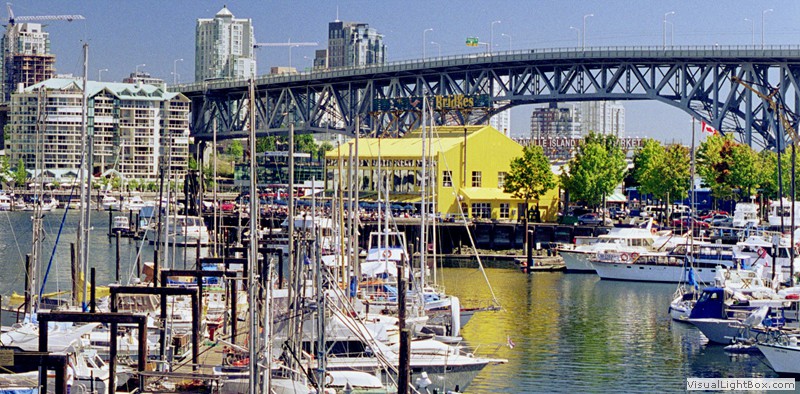
- Figure 5.10: Granville Island, Vancouver
- Figure 5.11: False Creek North, Vancouver, 2006
- Figure 5.12: Old Québec UNESCO World Heritage Site
- Figure 5.13: Benny Farm Master Plan, 2006
- Figure 5.15: Don Mills Plan, 1954
- Figure 5.16: Cornell Plan, Markham, Ontario
- Figure 5.17: Conventional Suburban Development (“snout house”)
- Figure 5.18: New Urbanist Streetscapes in Markham, Ontario
- Figure 5.19: Swan Lake, a Gated Community in Markham, Ontario
- Figure 5.20: Jane Jacobs, Urban Theorist
- Figure 5.21: OPPI Healthy Communities Policy Paper
- Figure 5.22: Ian McHarg
- Figure 5.23: Environmental Planning Process for the 1999 Ottawa-Carleton Regional Plan
- Figure 5.25: Ottawa’s Lowertown: Urban Renewal for an Expressway
- Figure 5.26: Public Art: Scarborough Expressway Pillars
- Figure 5.27: CPAC Female Councillors, 1967
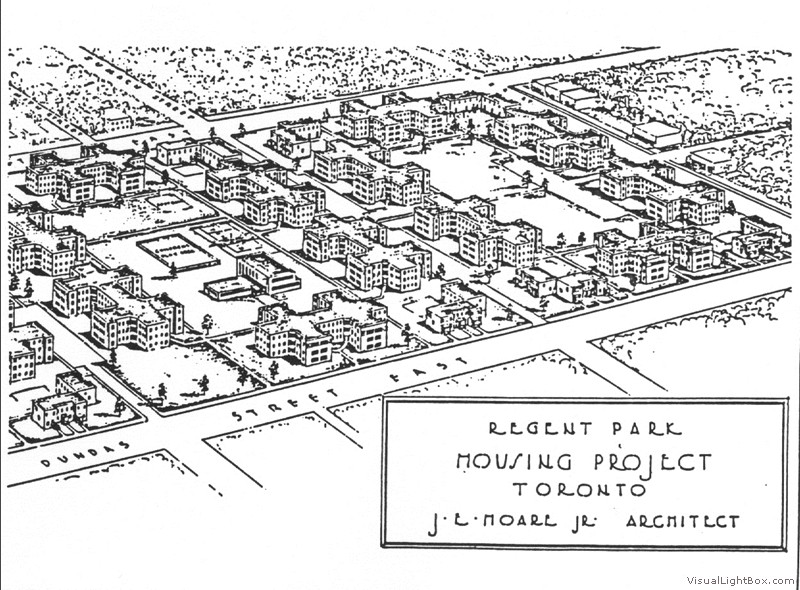
Source: ‘Regent Park Plan’ from Regent Park: A study in slum clearance, by Albert Rose, © University of Toronto Press 1958. Reprinted with permission of the publisher.
This early sketch of the spine of the St. Lawrence Neighbourhood, David Crombie Park, was directly inspired by Commonwealth Avenue in Boston’s Back Bay. This use of historic precedents from well-planned neighbourhoods is an indication of the switch from Modern to post-Modern urbanism. The short blocks and extension of Toronto’s street grid reflect Jane Jacob’s planning principles.
Source: City of Toronto Planning Department.
Source: DAVID GORDON.
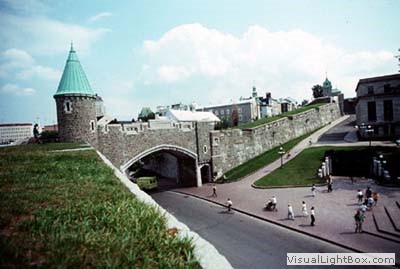
Old Québec was the first North American city to be designated as a World Heritage Site.
Source: Parks Canada, Pierre St. Jacques. Reproduced with the permission of the Minister of Public Works and Government Services Canada, 2012.
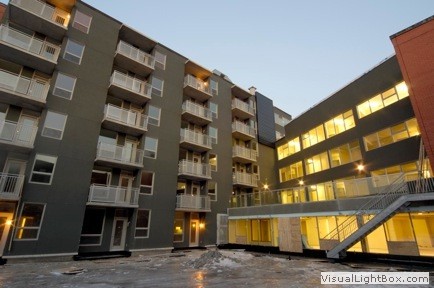
The existing small apartment blocks in Benny Farm were renovated and extended. New mid-rise veterans’ housing and condominium apartments were built on the east edge of the site and new townhouses on the west edge. Benny Farm received the Holcim award for green building in 2006.
Source: Canada Lands Company.
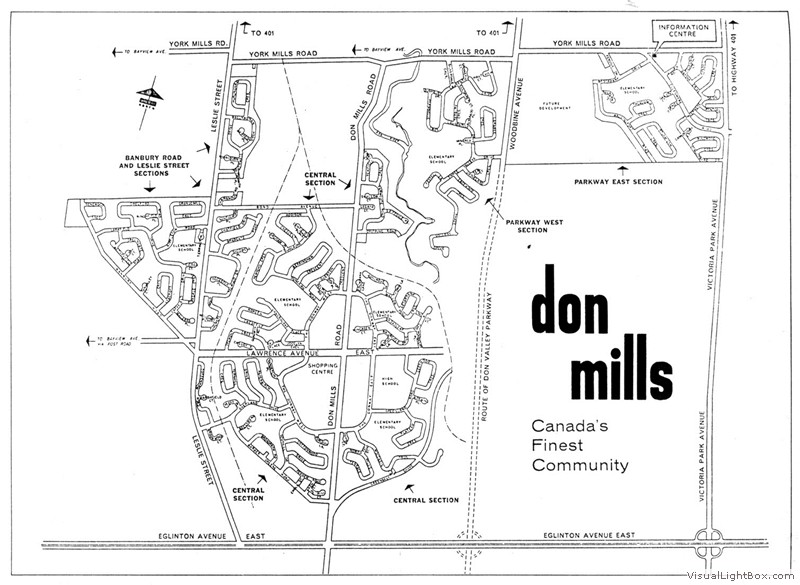
Macklin Hancock’s 1954 plan for Don Mills started with four neighbourhood units, connected by the collector ring road in the centre of the diagram this contemporary sales brochure. Employment areas (‘industrial parks’) were located to the north and south; the open space in the valley to the west was disrupted by construction of the Don Valley Parkway (dotted lines).
Source: John Sewell, ‘Don Mills: E.P. Taylor and Canada’s first corporate suburb’ in James Lorimer (ed.) The Second City Book (Toronto: Lorimer 1977) p. 25.
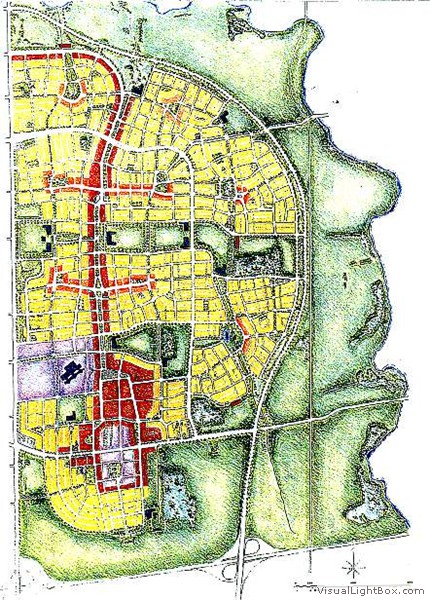
Source: Prepared for Ontario Ministry of Municipal Affairs and Housing. © Courtesy of Duany Plater-Zyberk and Co.
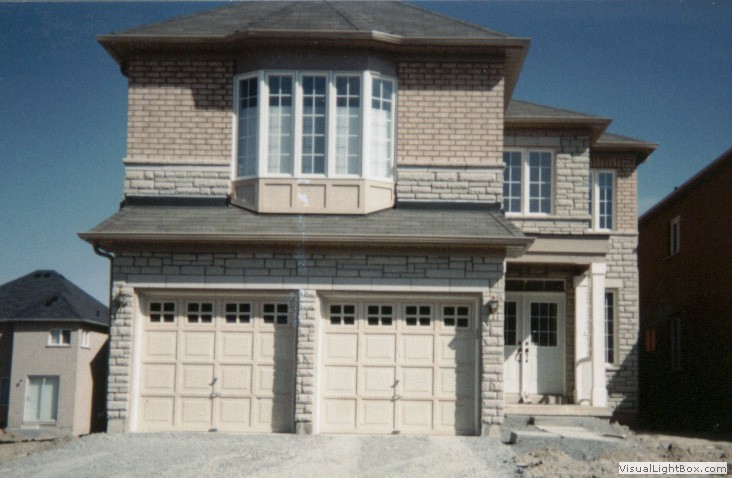
Source: Author’s collection.
Source: Author’s collection.
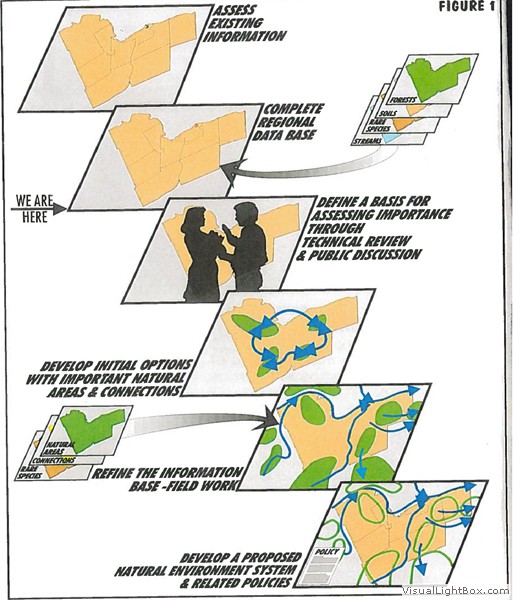
The environmental planning process for the 1999 Ottawa- Carleton regional plan was based on principles developed by Ian McHarg and Michael Hough. A sophisticated GIS allowed the regional planners to develop options that incorporated important natural areas and connections. The ecological planning was done first, and the natural environment system strategy formed the foundation for the regional land use planning.
Source: Natural Environment Systems Strategy, Review of the Natural Environment in Ottawa-Carleton poster, Regional Municipality of Ottawa-Carleton Planning and Property Department, February 1995. City of Ottawa Archives/2008.0190.1/0013.11.
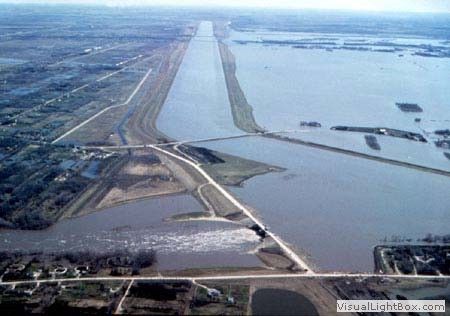
Most of Winnipeg is built within the flood plains of the Red and Assiniboine Rivers. The city was heavily damaged in the 1950 flood, and Manitoba premier Duff Roblin was ridiculed for spending millions of dollars to build a diversion channel east of the city. However, the floodway has saved the city from inundation several times. It narrowly contained flood flows in 1997, when an additional rise of half a metre would likely have overwhelmed Winnipeg’s diking system and caused several billion dollars in damages. So the floodway was expanded over the past decade.
Source: Reproduced with the permission of Natural Resources Canada 2012, courtesy of the Geological Survey of Canada (Photo 2000-118 by G.R. Brooks).
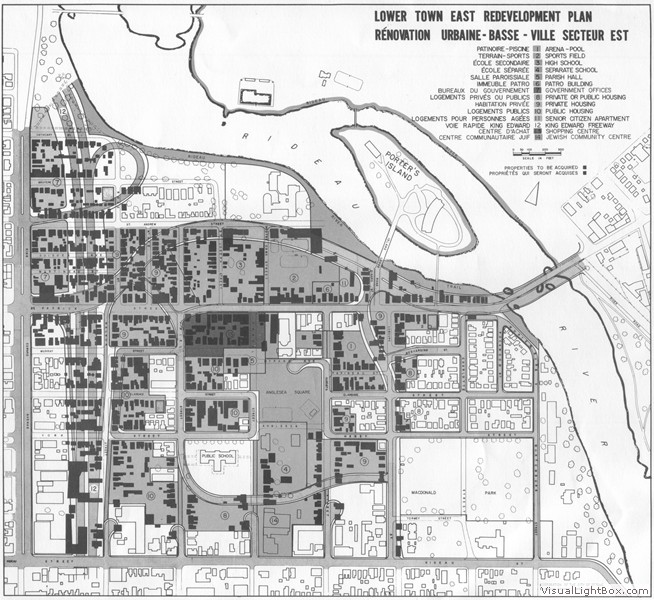
Ottawa Lowertown Urban Renewal Plan. The proposed King Edward Expressway is at left. The expressway was later cancelled, but the damage to the community was done, since many of the expropriated houses were demolished.
Source: Lower Town East Redevelopment Plan, Lowertown East Urban Renewal Project: Urban Design Concept and Development Plan, 1968 City of Ottawa Archives/RC-ARL/2011.0085.1
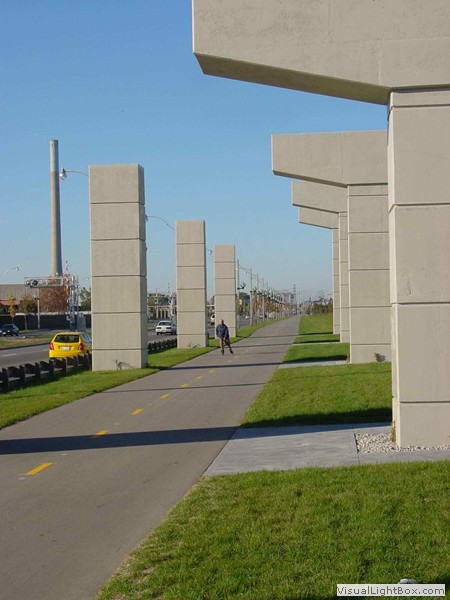
The end of the Scarborough Expressway. This elevated freeway was demolished in the late 1990s and replaced with a boulevard and bike path. Some of the expressway pillars were left as a monument to the previous era.
Source: “F. G. Gardiner dismantling project”. Photo courtesy of du Toit Allsep Hillier.
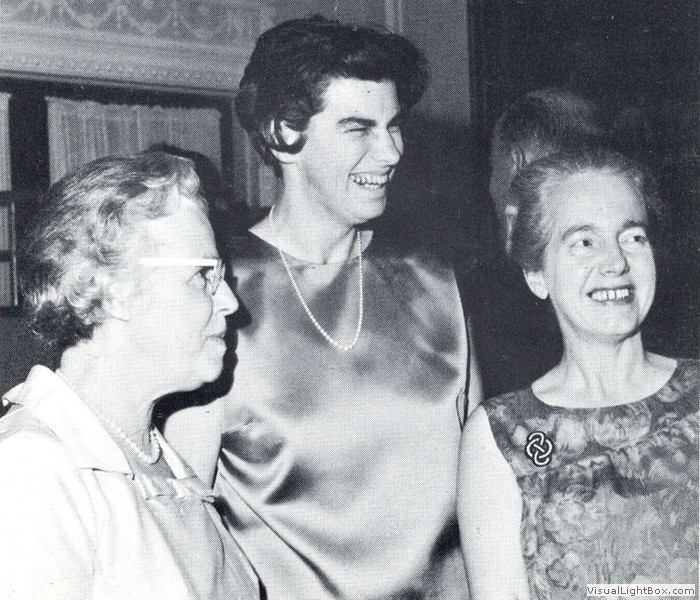
In 1967, the CPAC’s female councillors included (left to right) Elsie Shepherd (B.C.), Barbara Lambert (Ottawa), and Lynn Elliott Good (Kingston). Lin Good would be the only woman elected President of CPAC.
Source: Community Planning Review (1967), vol. 17(4), p.4; photo by Bill Cadzow. © Canadian Mortgage and Housing Corporation (CMHC).
Chapter 6: Steps in the Plan-making Process
- Figure 6.1: General Model of the Community Plan-Making Process
- Figure 6.2: Steps in the Conversion of Land to Residential Use
- Figure 6.3: Citizens Protest New Hog Plant, Winnipeg
- Figure 6.4: Official Plan (2010) Targets to be Monitored in York Region, Ontario
- Figure 6.5: Ottawa Greenbelt Sketch
- Figure 6.6: Christopher Alexander Sketch of Ideal Urban Form for “City – Country” Fingers
- Figure 6.7: Sketch of Proposed Urban Form for the 1948 Copenhagen “Finger Plan”
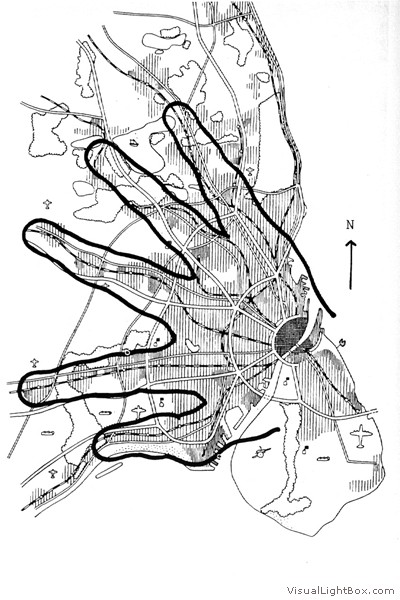
The 1948 plan for Copenhagen called for urban development to be concentrated in corridors in the valleys outside the city, separated by “green wedges” of open space along the higher ground, similar to Alexander’s theoretical pattern above. Rail and road facilities were improved in the valleys, leading to urban form in the shape of fingers leading from the historic core. This basic form was memorably illustrated by a simple sketch of a hand overlaid on the growth plan.
Source: 1948 plan for Copenhagen/AUTHORS’ collection.
Chapter 7: Focus on the Physical Environment
- Figure 7.1: Landscape Analysis Layers
- Figure 7.2: Patches, Corridors, and the Landscape Matrix
- Figure 7.3: Basic Land Uses in Communities
- Figure 7.4: Typical Land Use Shares of Major Urban Functions
- Figure 7.5: Standards of Accessibility from Home to Selected Urban Land Uses and Facilities
- Figure 7.6: Net and Gross Density
- Figure 7.7: Typical Densities (Net) of Different Forms of Housing
- Figure 7.8: Types of Housing Comprising Different Densities
- Figure 7.9: Density and Built Form
- Figure 7.10: The Rural – Urban Transect
The shaded area has 32 units on a total parcel area of 4 hectares, for a net density of 8 units per hectare.
Source: Adapted from Hitchcock, John, A Primer on the Use of Density in Land Use Planning (Toronto: University of Toronto, Program in Planning, DEPARTMENT OF GEOGRAPHY, 1994), Paper No. 41.
The shaded area now also includes 2 hectares of roads and 2 hectares of community facilities. So the gross density is 32 units divided by 8 hectares, or 4 units per hectare. Note that failing to specify whether a density is calculated upon a gross or net basis means that a planner could be incorrect by a factor of 50 – 100 percent.
Source: Adapted from Hitchcock, John, A Primer on the Use of Density in Land Use Planning (Toronto: University of Toronto, Program in Planning, DEPARTMENT OF GEOGRAPHY, 1994), Paper No. 41.
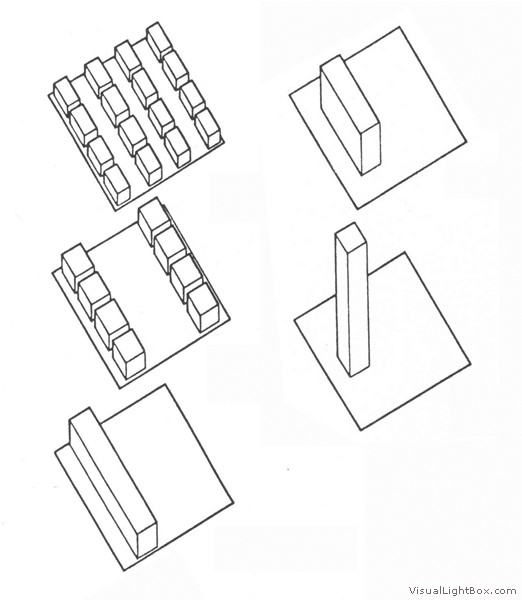
The density of development is only partially related to built form. The density of all five of the examples above is exactly the same. They all have a floor a Floor Area Ratio (FAR) of 1.0, which can be achieved by a) two storey townhouses covering 50% of the site; b) four storey townhouses covering 25% of the site; c) six storey deck access apartments covering 16% of the site; d) a ten storey slab apartment building covering 10% of the site or e) a 30 storey point tower covering 3% of the site. Most arguments about intensification revolve around building type, not density, since the townhouses might be acceptable to many neighbours in single detached houses, but the point tower would not.
Source: Author’s Collection.
Chapter 8: Planning Regional and Metropolitan Communities
- Figure 8.1: The Valley Section of Patrick Geddes
- Figure 8.2: The Trinity of Factors Intrinsic to Regional Planning
- Figure 8.4: Greater Toronto Bioregion
- Figure 8.5: Typology of Small, Rural, and Remote Communities (Ontario)
- Figure 8.6: Ebenezer Howard’s Concept of the Metropolitan Region
- Figure 8.7: Metro Vancouver Regional Growth Strategy
- Figure 8.8: Metropolitan Community of Montréal
- Figure 8.9: Four Forms of Metropolitan Development
- Figure 8.10: The Greenbelt in the National Capital Region
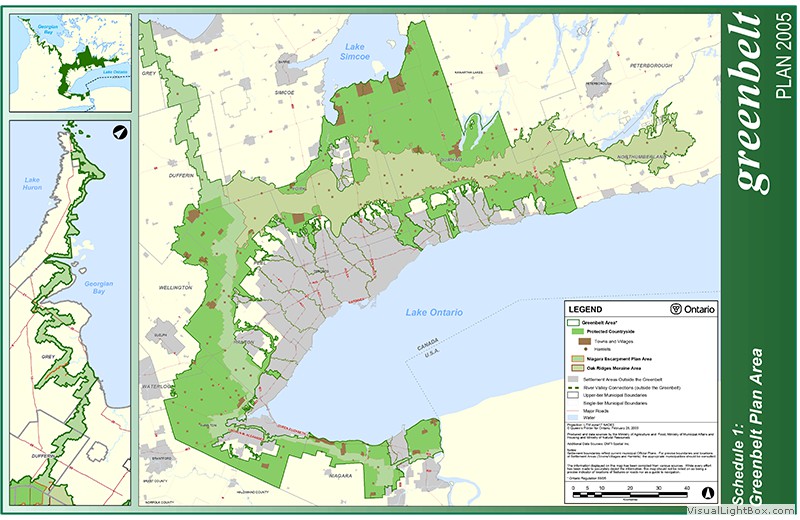
- Figure 8.11: South-Central Ontario’s Greenbelt Plan
- Figure 8.12: Places to Grow: The Growth Plan for the Greater Golden Horseshoe, Ontario, 2006
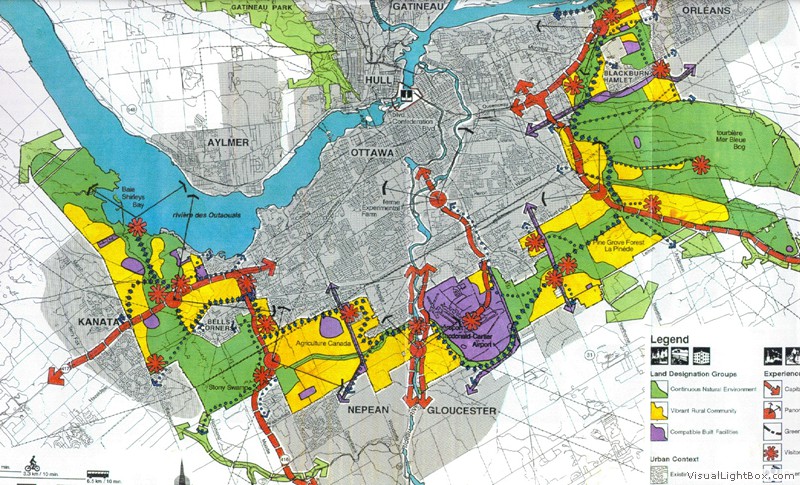
Source: Greenbelt Master Plan: Purpose, Roles and Concept Plan © NCC/CCN.
Chapter 9: The Urban Community Plan Its Characteristics and Role
- Figure 9.1: Functional Plans within the Ottawa 2020 Strategic Plan
- Figure 9.2: Community Plans for All Sizes of Communities
- Figure 9.3: Population Projection for Immigration in Winnipeg, 1987 – 2031
- Figure 9.4: Chains of Reasoning Employed in Predictive Studies
- Figure 9.5: Types of Information Used in Neighbourhood-Planning Analyses
- Figure 9.6: Key Role of the Community Plan in Land Use Control
- Figure 9.7: Relationship between Plans and Development Measures, Edmonton, 2000
- Figure 9.8: Comparative Provincial Planning Terminology
- Figure 9.9: Graphic Representation of 1961 Corridor Plan for the Washington, D.C., Region
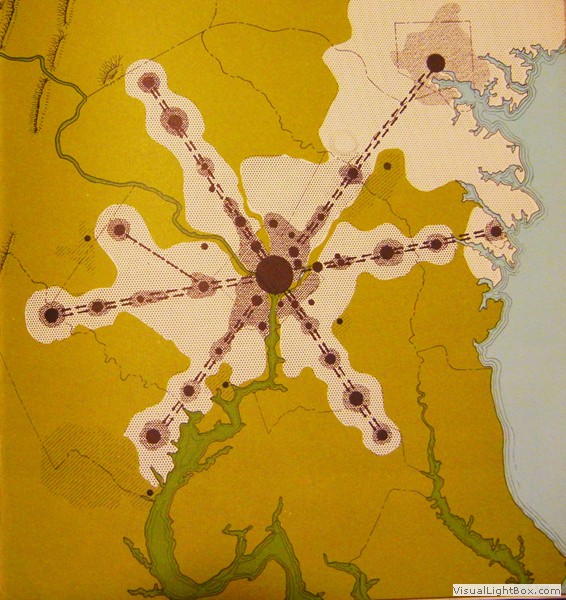
The rail corridors never extended as far into the country as planned, but this plan did accommodate the new towns of Reston, Virginia, and Columbia, Maryland a new international airport to the south and a stronger connection to Baltimore in the northeast.
Source: U.S. National Capital Planning Commission, A Policies Plan for the Year 2000 (Washington, D.C.: NCPC, 1961).
Chapter 10: Planning for Canada’s Small Towns and Northern Areas
- Figure 10.1: Rural Community Recycling Initiative, Hornby Island B.C., 2006
- Figure 10.2: The Relationship between Agriculture and Planning
- Figure 10.3: The Scope of Planning for Rural Communities
- Figure 10.4: Illustrating Rural Development Policy
- Figure 10.5: Rural Land Use Concept Plan, Langley, British Columbia, 2006
- Figure 10.6: Natuashish Plan
- Figure 10.7: Logo for Intergovernmental Aboriginal Planning (B.C.), 2008
- Figure 10.8: The Process of Aboriginal Community Planning
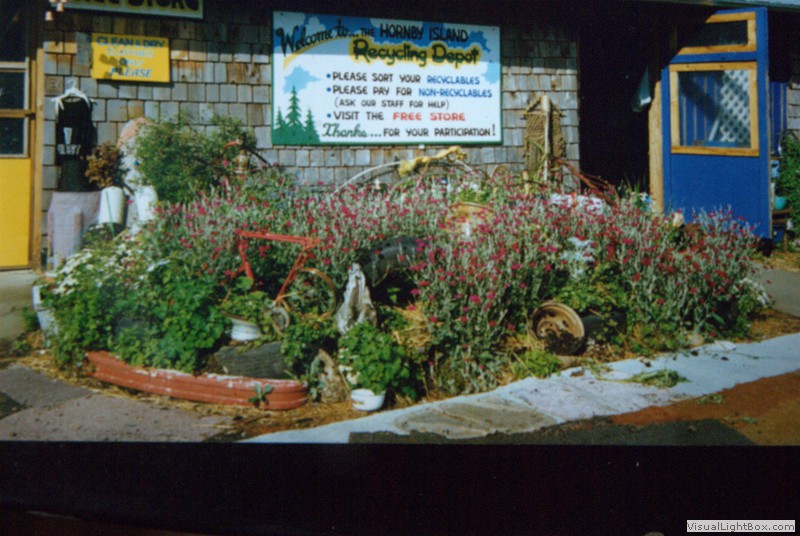
Opened in 1978, the Hornby Island Recycling Depot has been in operation for more than 30 years recycling and reusing more than 70 percent of this 1000-population community’s waste stream.
Source: Gerald Hodge.
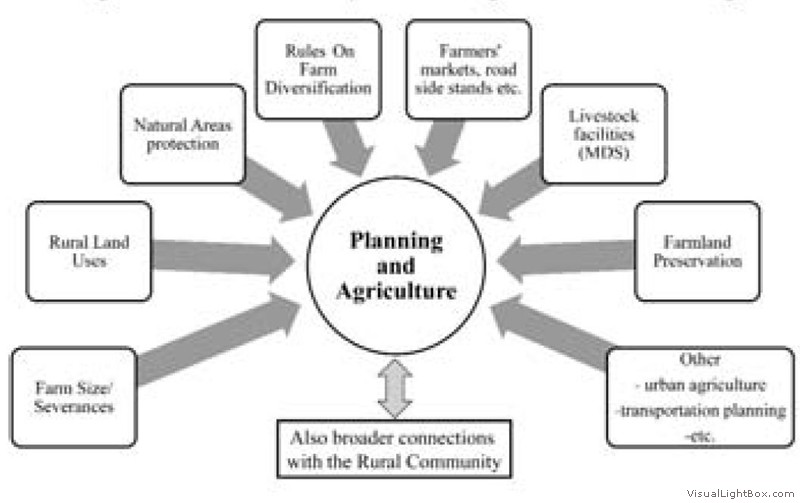
The practical elements of agricultural land use planning that challenge agriculture, the farming community, and planners.
Source: Caldwell, W.J. 2009, “The Evolving Nature of Agricultural Production: Implications for Planners”, Plan Canada, 49 (4): 46 (Figure 2).
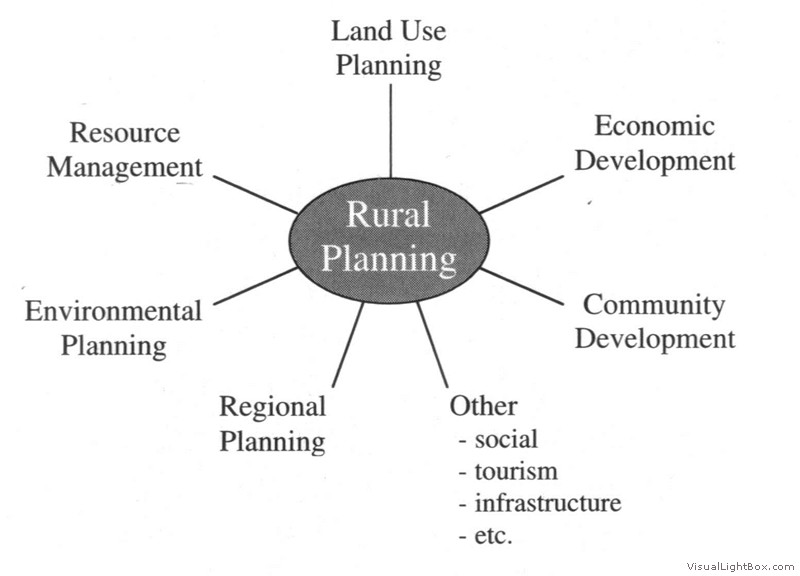
The rural planner’s task is diverse and demands attention to matters beyond land use planning including resource management, social and economic issues, and regional and environmental planning.
Source: After Caldwell, Plan Canada, 2005.
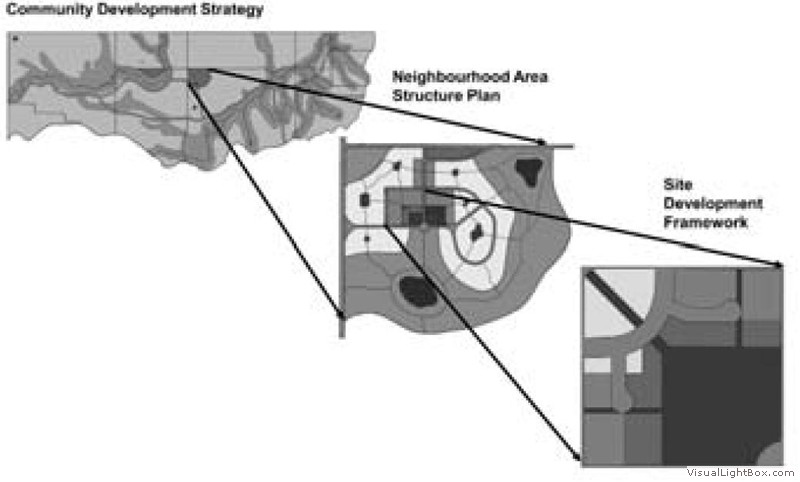
Rocky View County in Alberta plans at the three levels: (1) a Community Development Strategy describes the places to be created; (2) the Neighbourhood Area Structure Plan defines the arrangement of land uses; and (3) the Site Development Framework defines what the built environment will look like.
Source: McCardle. K. 2009, ‘”Rural” Planning in an Urbanizing Region’, Plan Canada 49 (4): 19 (Figure 1)., Plan Canada 49 (4): 19 (Figure 1).
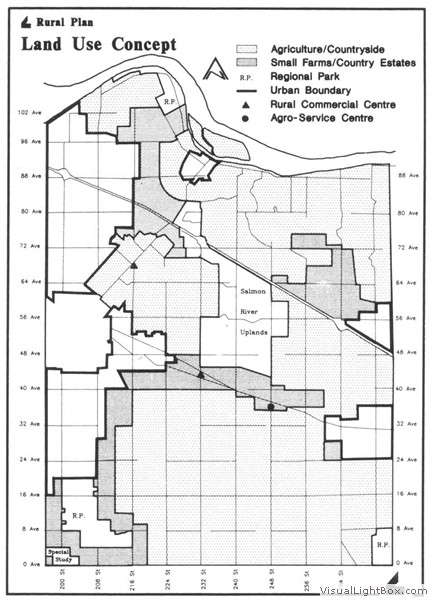
By explicitly designating areas for farming in community plans rural communities in urbanizing regions can sustain their agricultural resources.
Source: Township of Langley BC.
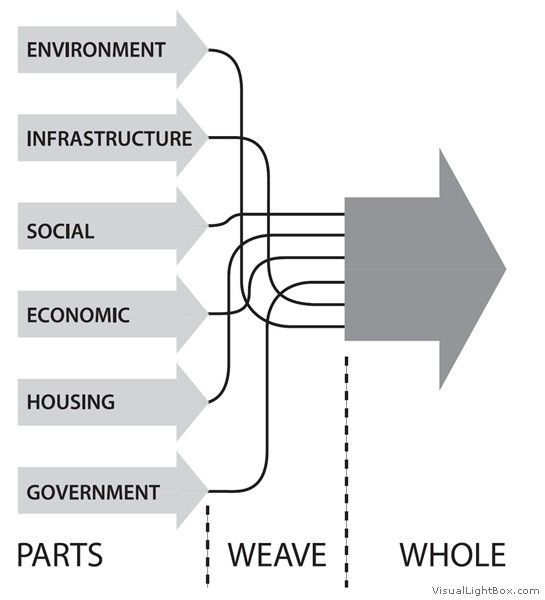
The process of building a community plan by seeing things as a whole.
Source: Mannell, L. & Ternoway, H. 2008, “The Need to do More: Advancing Planning with First Nations Communities”, Plan Canada 48 (2): 22.
Chapter 11: Neighbourhood and District Plans
- Figure 11.1: Comprehensive Land Use Plan Map: Montréal, 2004
- Figure 11.2: Neighbourhood Planning: Osborne Village, Winnipeg, 2012
- Figure 11.3: Special-Area Plan for a Residential District, Calgary
- Figure 11.4: Elgin Street in the Downtown Sudbury Master Plan, 2011, 2012
- Figure 11.5: Activity and Urban Form in Saskatoon Public Spaces, 2012
- Figure 11.6: The Bridges: Redevelopment Plan for the Calgary General Hospital Site, 2005
- Figure 11.7: Le Quartier des Spectacles, Montréal, 2007
- Figure 11.8: Edmonton City Centre Airport Redevelopment Plan, 2012
- Figure 11.9: Heritage Strategy for Downtown St. John’s, Newfoundland, 2002
- Figure 11.10: Cambie Corridor Plan, Vancouver, 2011
- Figure 11.11: Proposed Mobility Hub Locations for the Greater Toronto and Hamilton Area, 2011
- Figure 11.12: Brownfield Redevelopment: West Don Lands, Toronto
- Figure 11.13: Halifax: Waterfront Redevelopment on a Brownfield Site, 2010
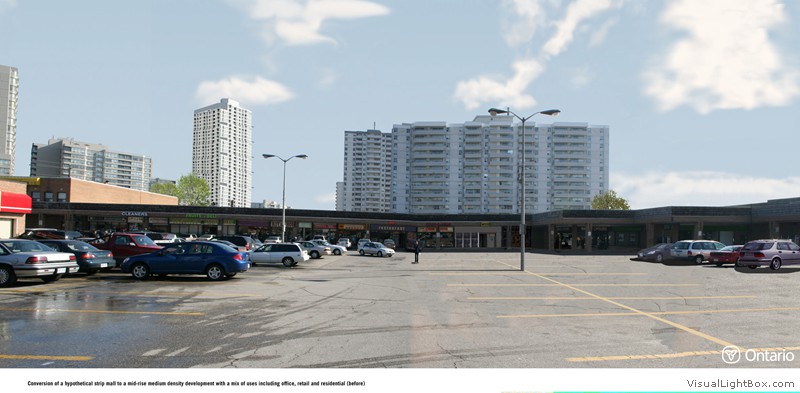
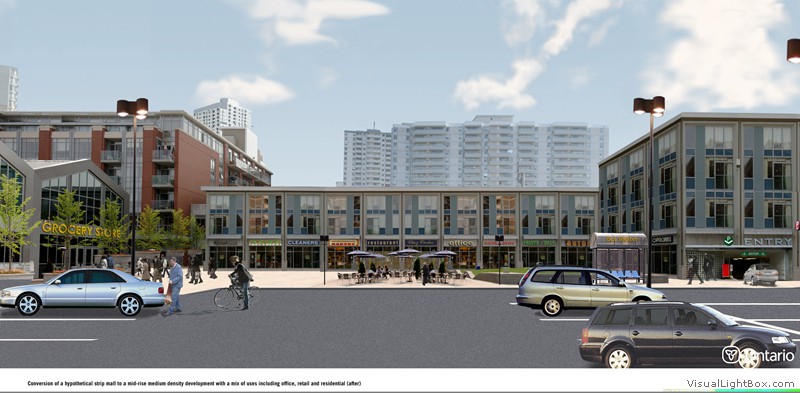
- Figure 11.14: Retrofitting Suburbia – Revitalizing a Commercial Arterial Strip
- Figure 11.15: Retrofitting Suburbia – Greyfield Plan for a Community Shopping Centre
- Figure 11.16: Military Base Redevelopment, Currie Barracks, Calgary
- Figure 11.17: Sustainable Subdivision Design, East Clayton Neighbourhood, Surrey, B.C., 2000
- Figure 11.18: Draft Plan of a Subdivision, Ontario
- Figure 11.19: Site Plan for an Affordable Housing Project, Montréal
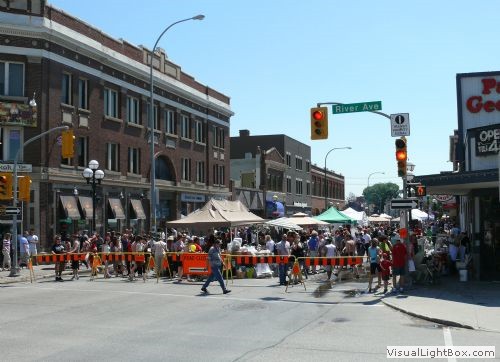
A street festival in Winnipeg’s Osborne Village, which was voted “Canada’s Great Neighbourhood” in the 2012 Great Places in Canada competition.
Source: Christopher Baker/City of Winnipeg.
This image illustrates changed land uses and public space improvements proposed for Elgin Street in downtown Sudbury. Note the green street components and mixed use buildings on the right, with improved sidewalks and pedestrian-oriented shops. The plan won an honourable mention for neighbourhood planning in the CIP’s 2012 awards program.
Source: Downtown Sudbury Master Plan & Action Strategy, 2011, City of Sudbury.
Preliminary images for the sustainable redevelopment of the former Edmonton City Centre Airport site.
Source: Transforming Edmonton: Bringing Our City Vision to Life, Blatchford Redevelopment, City of Edmonton.
The Cambie Corridor Plan existing conditions (this slide) and proposals for intensification at King Edward Av. (next slide – Figure 11.10b: Cambie Corridor Plan, Vancouver, 2011.). The plan won the CIP’s Sustainable Mobility Award in 2012, but has been intensely controversial. Even though there is a new rapid transit line running underneath Cambie Street, residents in the single detached homes in the adjacent blocks object to the scale of development proposed.
Source: (a) © City of Vancouver/City of Vancouver Archives CVA 772-340; (b) City of Vancouver Planning Department.

The Cambie Corridor Plan existing conditions (previous slide – Figure 11.10a: Cambie Corridor Plan, Vancouver, 2011.) and proposals for intensification at King Edward Av. (this slide). The plan won the CIP’s Sustainable Mobility Award in 2012, but has been intensely controversial. Even though there is a new rapid transit line running underneath Cambie Street, residents in the single detached homes in the adjacent blocks object to the scale of development proposed.
Source: (a) © City of Vancouver/City of Vancouver Archives CVA 772-340; (b) City of Vancouver Planning Department.
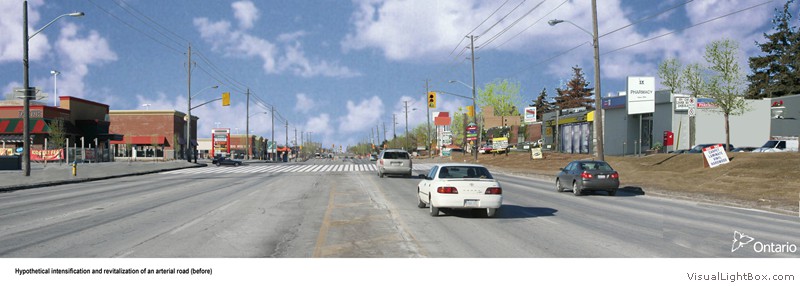
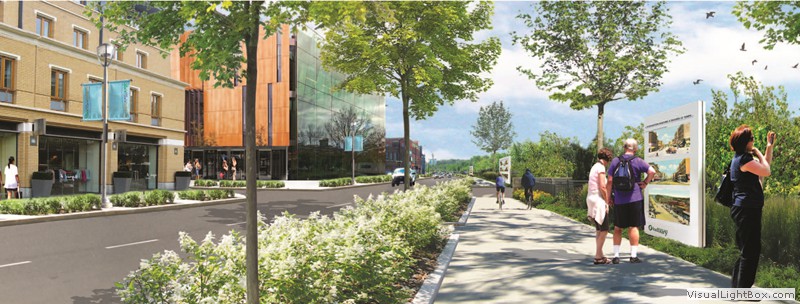
Hypothetical intensification and revitalization of an arterial road, showing starting conditions that might be found in any Canadian suburb (this slide): a wide road right-of-way; parking out front; scattered commercial buildings; and miserable conditions for pedestrians, cyclists, and transit riders. (next slide – Figure 11.14b: Retrofitting Suburbia – Revitalizing a Commercial Arterial Strip): illustrates typical sprawl repair techniques: a “complete street” that maintains the four traffic lanes, but adds transit priority, cycle lanes, sidewalks, and street trees. Buildings are moved up to the street line and made with continuous frontage, a mix of uses, retail at grade, and some parking along the street. This computer visualization illustrated the intensification principles for the Growth Plan for the Greater Golden Horseshoe, which won the 2007 CIP National Planning Award and Daniel Burnham Award from the American Planning Association.
Source: Places to Grow Growth Plan for the Greater Golden Horseshoe, 2006, Office Consolidation, January 2012, Ontario Growth Secretariat, Ministry of Infrastructure. © Queen’s Printer for Ontario, 2012.
Hypothetical intensification and revitalization of a dying suburban community shopping centre (top): note the huge and almost empty parking lot, the apartments within walking distance, and no facilities for pedestrians, cyclists, or transit riders.
Source: Places to Grow Growth Plan for the GREATER Golden Horseshoe, 2006, Office Consolidation, January 2012, Ontario Growth Secretariat, Ministry of Infrastructure. © Queen’s Printer for Ontario, 2012. Reproduced with permission.
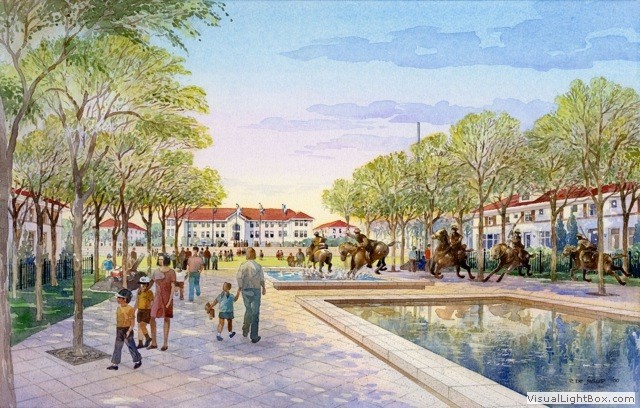
The redevelopment of the third and last phase for the former CFB Calgary is the 81-hectare Currie Barracks site in Calgary’s inner suburbs. The first two phases, Garrison Woods and Garrison Green, won several awards for their planning and urban design. Currie Barracks was the first project in Canada to earn gold certification for its plan from the LEED for Neighbourhood Development program.
Source: Canada Lands Company.
Chapter 12: Planning Infrastructure Systems to Connect Communities
- Figure 12.1: Parks Systems Planning in Red Deer, Alberta, 2010
- Figure 12.2: Green and Blue Links in the 1999 Ottawa-Carleton Regional Plan
- Figure 12.3: Don River Valley Rehabilitation Strategy, Toronto, 1991
- Figure 12.4: North Pigeon Lake Area Structure Plan, Leduc County, Alberta, 2011
- Figure 12.5: Waterfront Planning: Les Bassins du Nouveau Havre, Montréal, 2009
- Figure 12.6: Improving Pedestrian and Cycling Infrastructure
- Figure 12.7: Transit-Supportive Planning Guidelines
- Figure 12.8: Conventional Street Hierarchy Compared to Traditional Street Types
- Figure 12.9: Transformation of Montréal’s Bonaventure Expressway into an Urban Boulevard
- Figure 12.10: Main Water Supply System in Winnipeg’s New Plan, 2011
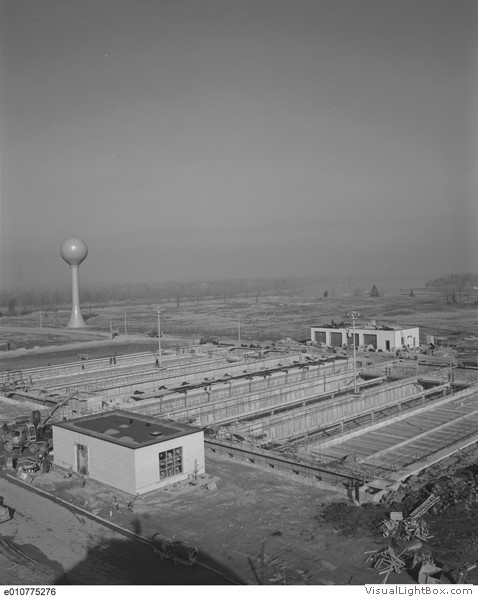
- Figure 12.11: Green’s Creek Water Pollution Control Plant, Ottawa
- Figure 12.12: Stormwater Mitigation: Winnipeg Green Parking Lot Design, 2011
- Figure 12.13: District Heating Proposal: New Monaco, British Columbia, 2011
- Figure 12.14: Muskoseepi Park Plan, Grand Prairie, Alberta, 2009
- Figure 12.15: Infrastructure as Public Art
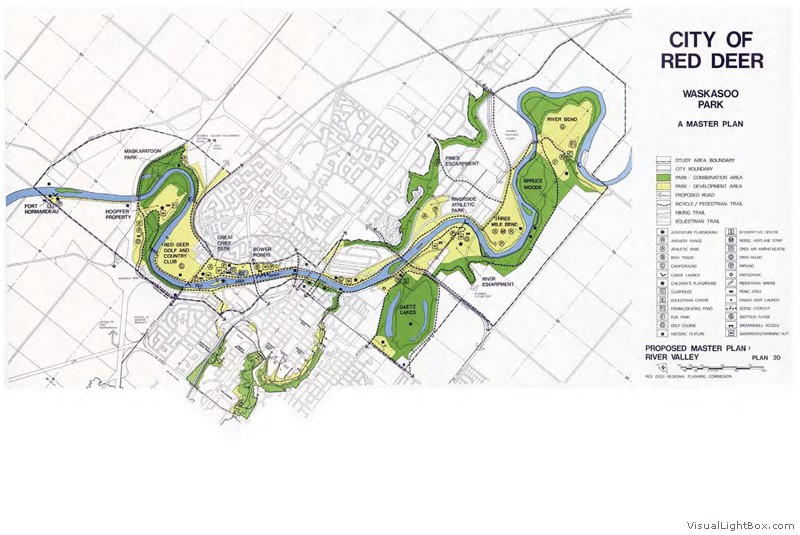
Parks systems planning in Red Deer considers the entire river valley. The plan received the 2011 CIP Recreation Planning Award.
Source: River Valley + Tributaries Park Concept Plan, court esy of Parkland Community Planning Serv ices.
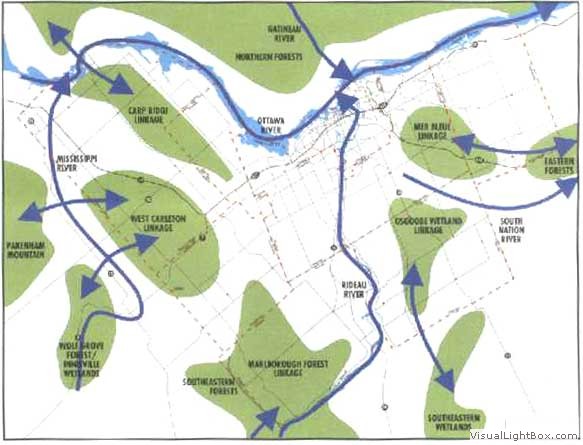
Source: Adjacent Natural Environments, Review of The Natural Environment in Ottawa-Carleton Poster, Regional Municipality of Ottawa-Carleton Planning and Property Department, February 1995/City of Ottawa Archives/2008.0190.1/0013.11.
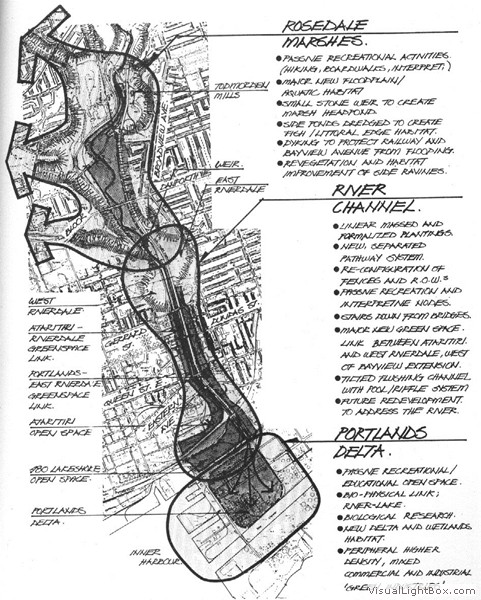
This strategy to clean up the lower Don River proposed creating new marshes and habitat (upper portion of the drawing), increasing public access along the channel (middle), and re-naturalizing the mouth of the river (lower). The plan won the 1992 CIP National Award of Excellence, and the first two phases were extensively implemented with the leadership of a citizens’ advocacy group, the Task Force to Bring Back the Don. Rehabilitating the mouth of the river may take another 20 years.
Source: Bringing Back the Don, Hough Stansbury Woodland, Ltd . DRAWING BY KEN TAMMINGA.
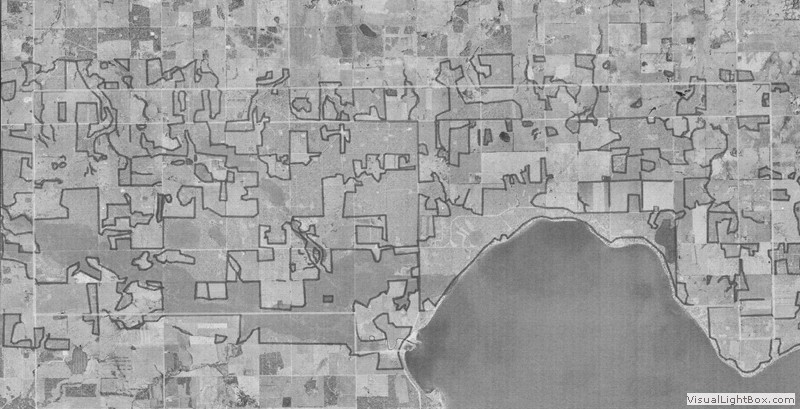
This image shows the vegetation patches in the immediate drainage area of North Pigeon Lake. Leduc County’s Area Structure Plan manages growth and land uses around the north side of this lake, based upon ecological planning principles. The plan received an honourable mention for environmental planning in the 2011 CIP Awards.
Source: North Pigeon Lake Area Structure Plan, Leduc County, © Bruce Thompson and Associates.
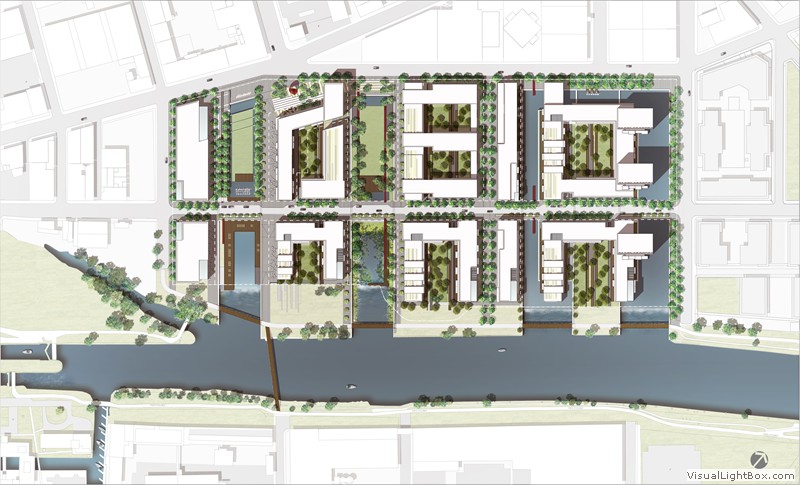
Les Bassins du Nouveau Havre are a redevelopment of former industrial waterfront lands adjacent to Montréal’s Lachine Canal. Cardinal Hardy’s plan received a 2009 award for urban design from the CIP.
Source: Canada Lands Company.
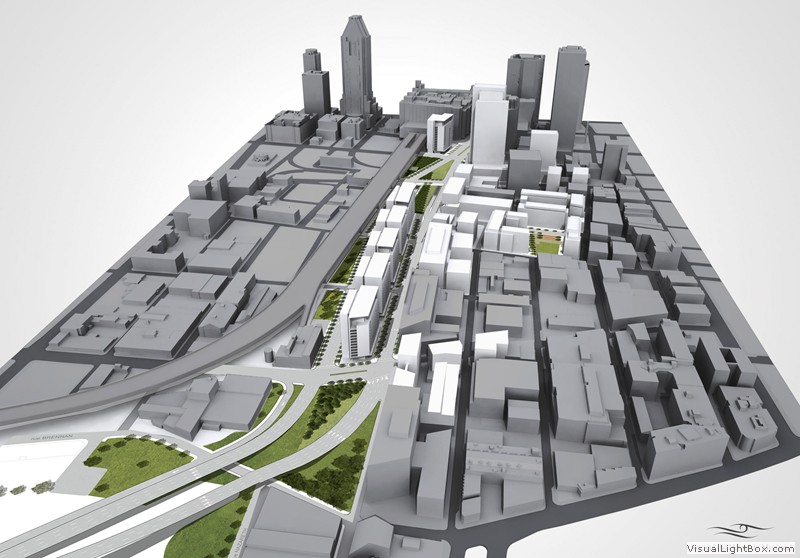
The elevated Bonaventure Expressway was a major barrier in Montréal’s Downtown Gateway in 2007 (a).
Source: (a): © Société du Havr e de Montréal, 2007. (b): Cardinal Hardy © Société du Havr e de Montréal, 2007.
The elevated Bonaventure Expressway was a major barrier in Montréal’s Downtown Gateway in 2007 (a).
Source: (a): © Société du Havr e de Montréal, 2007. (b): Cardinal Hardy © Société du Havr e de Montréal, 2007.
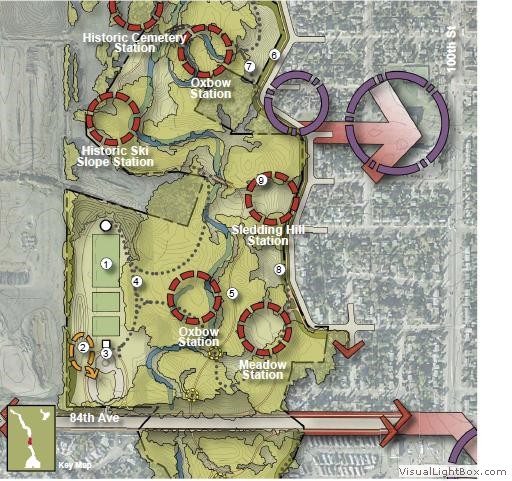
Recreation projects for the Bear Creek Corridor of the Muskoseepi Park.
Source: Copyright Studio Outside, All Rights Reserved.

SOURCE: Gerald Hodge.
SOURCE: David Gordon.
SOURCE: David Gordon.
Chapter 13: Planning for Diverse and Healthy Communities
- Figure 13.1: Impending Surge in the Seniors’ Population
- Figure 13.1: Impending Surge in the Seniors’ Population
- Figure 13.4: Preparing for Seniors’ Planning: A Checklist
- Figure 13.5: Age-Friendly Topics
- Figure 13.6: Ethnic Enclaves in the Toronto CMA, 2006
- Figure 13.7: A Ladder of Planning Principles Supporting Multiculturalism
- Figure 13.8: Gender Differences Regarding Safety in Transportation Settings after Dark
- Figure 13.10: Indicators of Environmental Quality for Children and Youth
- Figure 13.11: “Got Questions or Ideas?”
- Figure 13.12: Relative Differences in Accessibility
- Figure 13.13: Accessibility and Universal Design in Winnipeg
- Figure 13.14: The Homeless Housing Iceberg
- Figure 13.15: Healthy Community Subdivision Guidelines
- Figure 13.16: Healthy Communities: Key Issues and Possible Alliances
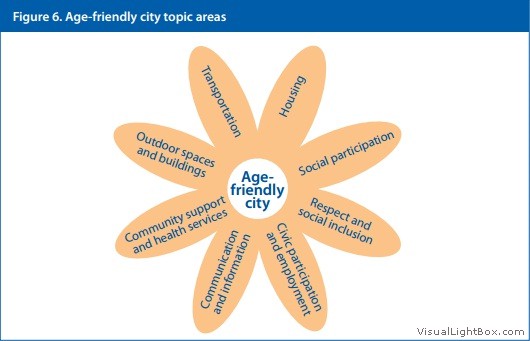
Eight topics guide Age-Friendly planning initiatives by the World Health Organization.
Source: World Health Organization, Global age-friendly cities: a guide, (Geneva, 2007), Figure 6, p. 9.
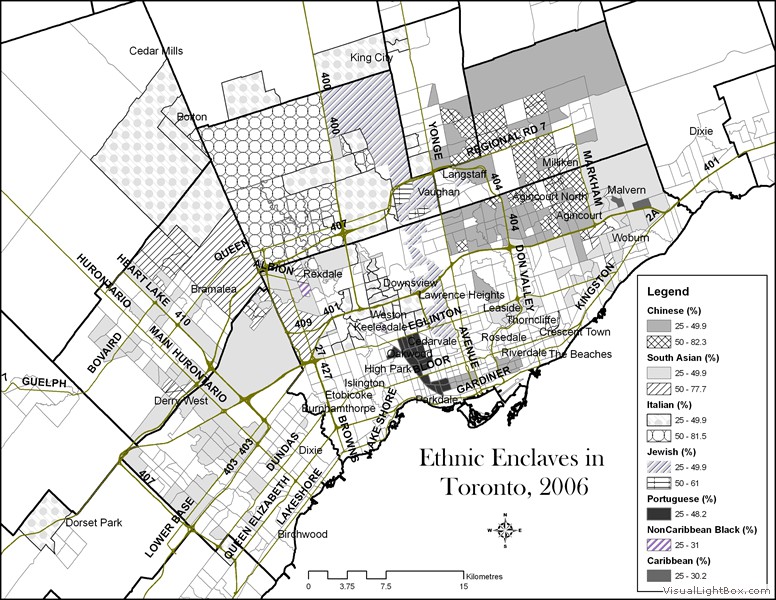
Note the many ethnic enclaves in Toronto’s suburban municipalities.
Source: Mohammad Qadeer, Sandeep K. Agrawal and Alexander Lovell. “Evolution of Ethnic Enclaves in the Toronto Metropolitan Area, 2001-2006” Journal of International Migration and Integration, (2010) 11:326, Figure 2. With kind permission from Springer Science and Business Media. (2004), map 3.1.1
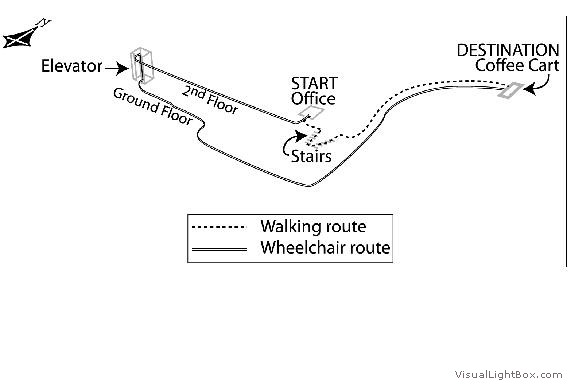
The routes of two people, one ambulatory and one using a wheelchair, seeking a coffee break.
Source: Richard L. Church and James R. Marston, “Measuring Accessibility for People with a Disability,” Geographical Analysis 35:1 (January 2003) p. 91, lower half of Fig.1. Reproduced with permission.
The persons counted as homeless, on the street and in shelters, are above the waterline. There remains an even greater number who are potentially homeless, the “hidden homeless.”
Source: Metro Vancouver, Regional Steering Committee on Homelessness, One Step Forward, 2012; Figure 1, p. 1
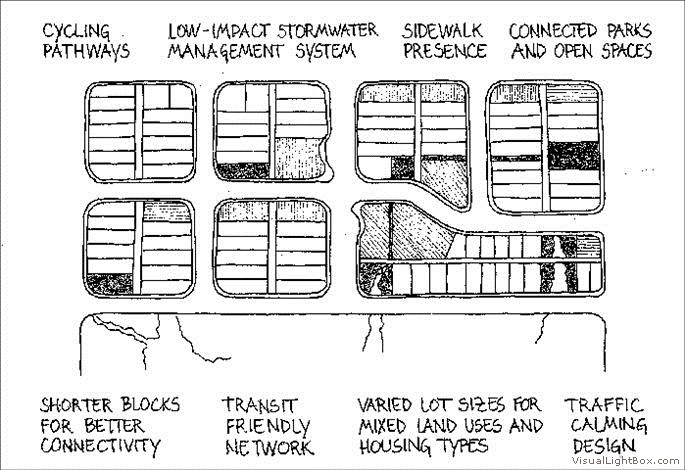
This diagram shows several healthy community practices that can be implemented during the subdivision stage of land use planning.
Source: Ontario Ministry of Municipal Affairs and Housing and the Ontario Professional Planners Institute, Planning By Design: a healthy communities handbook, (2009) P.20, © QUEEN’S PRINTER FOR ONTARIO, 2009. REPRODUCED WITH PERMISSION.

This diagram presents the wide range of topic areas and potential alliances needed for planners to create healthy communities.
Source: Healthy Communities Practice Guide, Ottawa , 2012, Figure 1, p. 6. Canadian Institute of Planners.
Chapter 14: Deciding Upon the Community’s Plan
- Figure 14.1: The Formal (Municipal) Planning Process
- Figure 14.2: Key Participants in the Phases of Community Planning
- Figure 14.3: Public Engagement Techniques for Saskatoon Speaks, 2011
- Figure 14.4: Loh’s Four Potential Disconnects in the Planning Process
- Figure 14.5: “Theory” and “Practice”
- Figure 14.6: Model of the Planning Process Used in Corporations
- Figure 14.7: The Place of Planning in Community Decision Making
- Figure 14.8: Demolition of Calgary’s East Victoria Park Neighbourhood, 2006
Chapter 15: The Texture of Participation in Community Planning
- Figure 15.1: The Six-Sided Triangle of Planning Participation
- Figure 15.2: Typical Public Meeting
- Figure 15.3: Ladder of Citizen Participation
- Figure 15.4: Children Involved in a Safety Audit in Winnipeg
- Figure 15.5: Ladder of Empowerment
- Figure 15.6: Vernon, B.C., Community Visioning Results, 2011
- Figure 15.7: Consensus-Building around a Table in Burnaby, 2012
- Figure 15.8: Components of the Circle Process
- Figure 15.9: Participants in the Development of an Urban Project
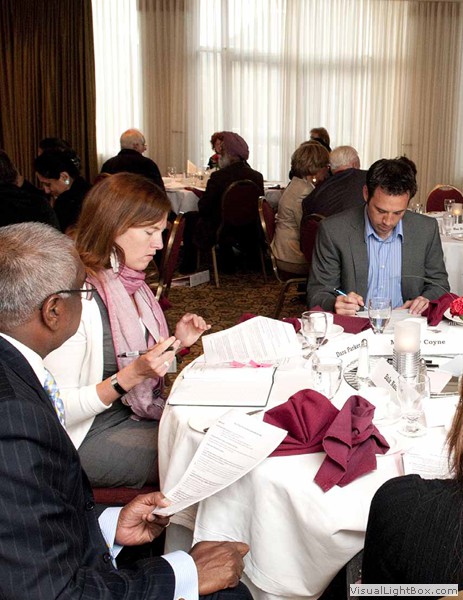
The City of Burnaby, B.C., engaged a broad range of stakeholders to build consensus for its social sustainability strategy. The project received the CIP 2012 Social Planning Award.
Source: Burnaby Social Sustainability Strategy Report; City of Burnaby.
Chapter 16: Land-use Regulation Tools for Plan Implementation
- Figure 16.1: Key Role of the Community Plan in Land Use Control
- Figure 16.2: Simple Zoning Map
- Figure 16.3: Land Use Districts in Typical Zoning Bylaw for a Medium-Sized City
- Figure 16.4: Basic Dimensions for the Placement, Coverage, and Height of Structures on Building Lots (the “Building Envelope”)
- Figure 16.6: The Increasing Bulk of Recent Dwellings
- Figure 16.7: Zoning Bylaw Sign Control Diagrams of Truro, N.S., 2010
- Figure 16.8: Visualization of a Proposed Mixed-Use Centre at a Rapid Transit Station
- Figure 16.9: Form-Based Code – Revelstoke, B.C., 2012
- Figure 16.10: Planning Checklist for Proposed Residential Subdivisions
- Figure 16.11: Rural Consents on Prime Agricultural Land
- Figure 16.12: Condominium Plan for an Apartment Building
- Figure 16.13: Development Permit System
- Figure 16.14: Density Bonusing and Transfer of Development Rights
- Figure 16.15: East of Bay (Toronto) Urban Design Guidelines, 1990 – 2005
- Figure 16.16: Montréal View Control Diagram, 2003
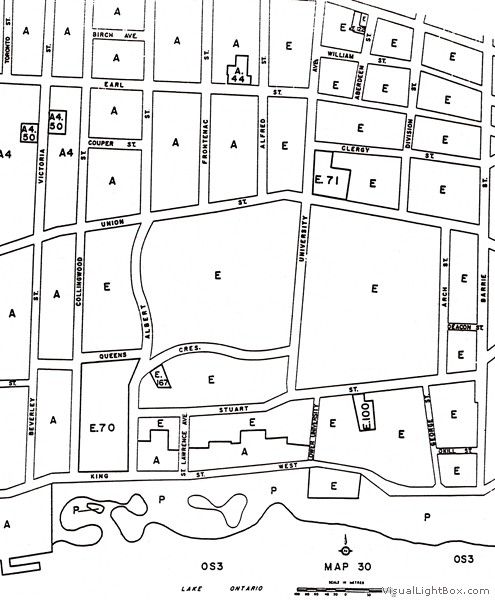
Zoning maps are precise drawings based on property boundaries, as illustrated in this simple zoning bylaw diagram from a medium-sized city. Note the way that the boundary of the “A” zone (low-density residential use) meets the
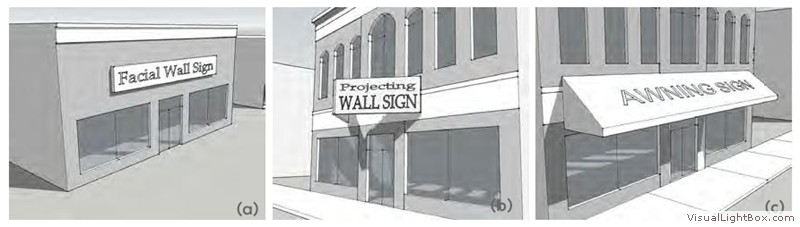
These images from the zoning bylaw of Truro N.S., demonstrate how a small town controls signs along its main commercial street. Image (a) is for a wall sign attached to the façade of the building. Image (b) illustrates a projecting wall sign, while image (c) demonstrates a sign printed on an awning. The bylaw mandates the size and location of each type of sign. This bylaw’s illustrated approach helped Truro win a CIP 2011 award for small town planning.
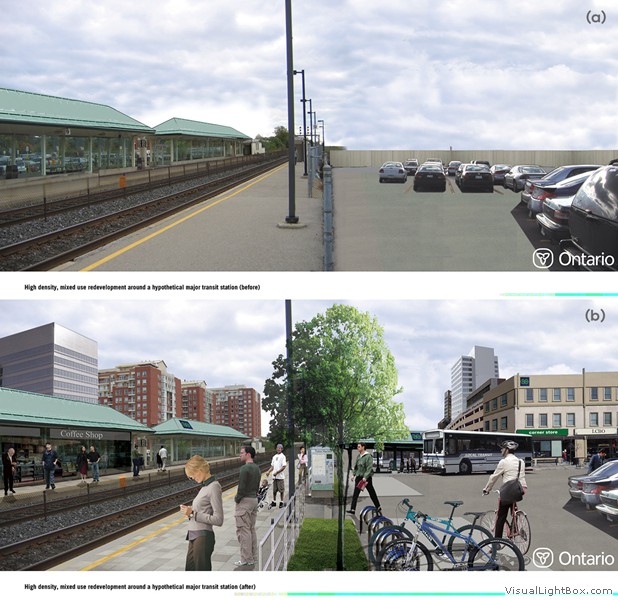
Figure 16.8b: Visualization of a Proposed Mixed-Use Centre at a Rapid Transit Station.
Before and after images for proposed mixed-use redevelopment of a commuter rail transit station in the GTA (greater Toronto area) in 3-D visualization. Station intensification is encouraged by provincial guidelines that specify a minimum density for each transit node and corridor.
Source: Places to Grow Growth Plan for the Greater Golden Horseshoe, 2006, Office Consolidation, January 2012 Ontario Growth Secretariat, Ministry of Infrastructure.© Queen’s Printer for Ontario, 2012. Reproduced with permission.
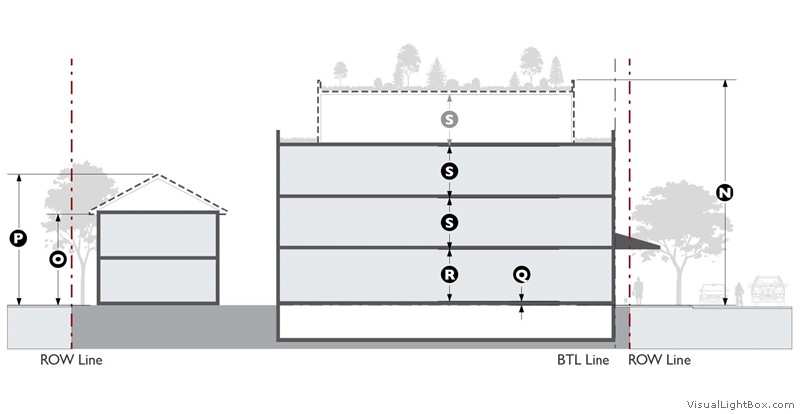
This diagram from Revelstoke’s Unified Development Code shows how the techniques of form-based coding can be deployed to control mixed-use building types in a small city. Clear graphics illustrate the heights of the main structure and outbuildings (N and P), the location for retail (R), and the build-to-line (BTL) that ensures a continuous street-wall on a main street.
Source: City of Revelstoke and Selkirk Planning and Design (Fraser Blyth).
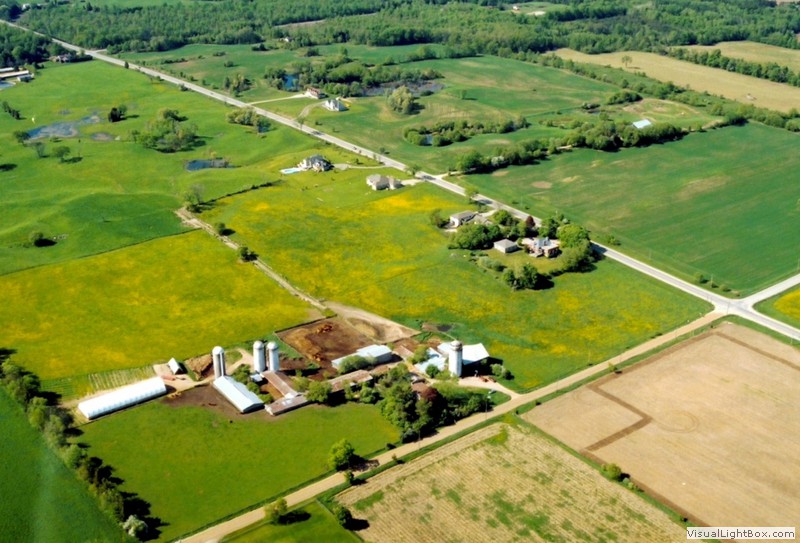
Too many adjacent residential lots on prime agricultural land may compromise the effectiveness of this farm community near Guelph, Ontario.
Source: The Farmland Preserv ation Research Project at the University of Guelph.
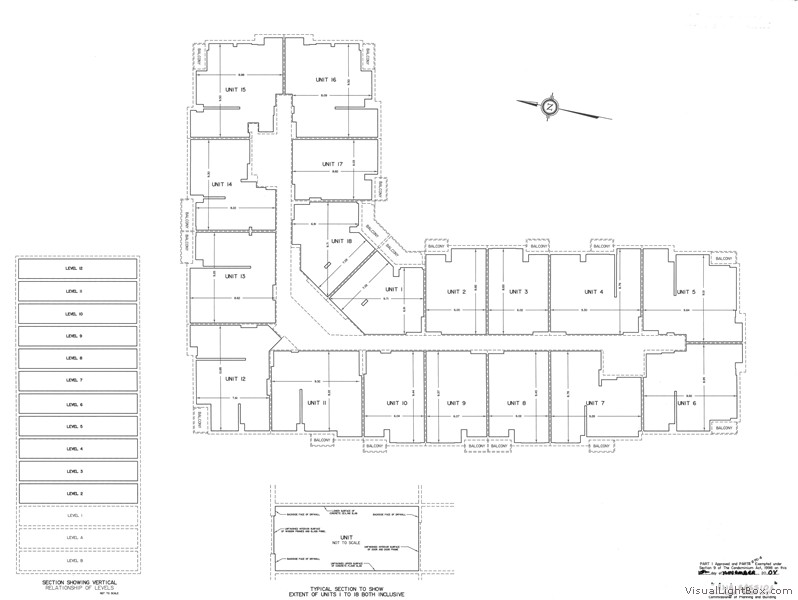
This drawing shows the floor plan (right) and section (left) of an apartment building, creating a condominium plan. A draft version of this drawing was circulated for comments and approval in a process similar to a subdivision; except that condominium plans have three dimensions.
Source: York Region Standard Condominium Plan 1134, Registered 14th November 2008. © MMM Group Limited.
Most development permit systems allow for approval of height, massing, siting, and landscaping. Ontario’s system also considers bonus zoning for public benefits.
Source: Building Blocks for Sustainable Planning – 11 in a Series of 12: Development Permit System (s. 70.2 and O. Reg. 608/06) Ministry of Municipal Affairs and Housing © Queen’s Printer for Ontario, 2009. Reproduced with permission.

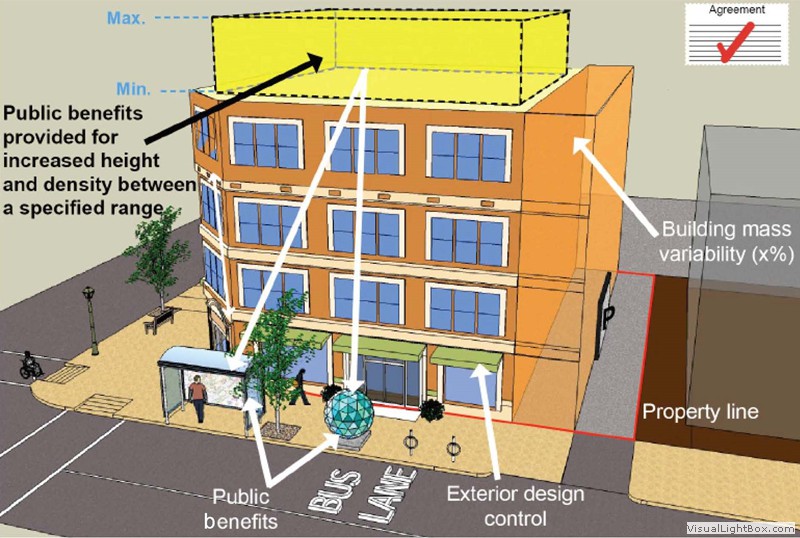
The building in this site plan drawing would receive extra height and a density bonus in exchange for public benefits such as the daycare centre and public art. Transfer of Development Rights (TDR) is another form of reward for a public benefit, such as preserving a heritage building or wetland. The development rights that would normally be associated with the heritage or ecological property would be transferred to an adjacent parcel such as the one in this image.
Source: Building Blocks for Sustainable Planning – 5 in a Series of 12: Height and Density Bonusing (s. 37) Ministry of Municipal Affairs and Housing © Queen’s Printer for Ontario, 2008. Reproduced with permission.
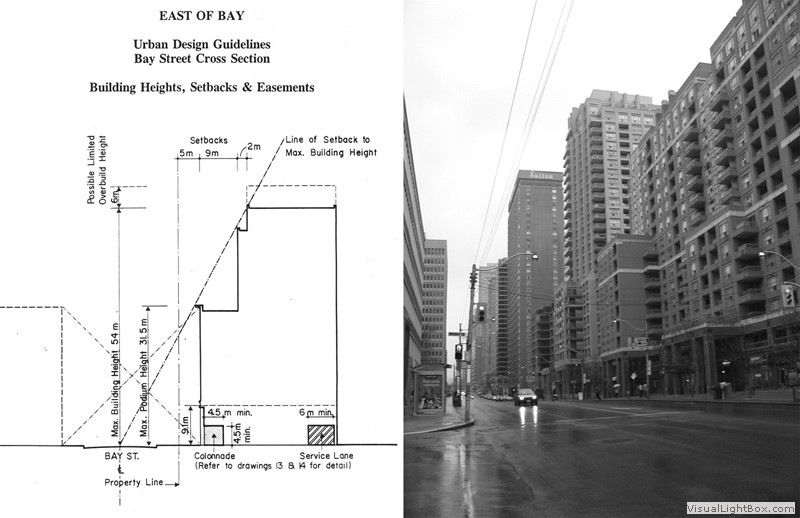
This urban design guideline for the Bay Street canyon in midtown Toronto was consciously modeled on the 60 degree angular plane in the 1916 zoning bylaw that controls building height on the north-south avenues in Manhattan. The image on the right shows the effect of the guideline on built form in 2005.
Source: The Kirkland Partnership Ed.
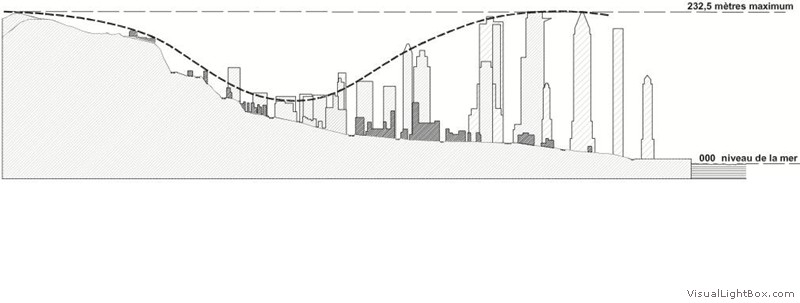
Montréal’s Master Plan controls the location and height of tall buildings in the CBD to ensure that Mount Royal has a prominent role on the city’s skyline.
Source: City of Montreal.
Chapter 17: Policy Tools for Plan Implementation
- Figure 17.1: A Guide to Municipal Decision-Making, Edmonton
- Figure 17.2: Winnipeg Capital Budget and the Growing Infrastructure Deficit
- Figure 17.4: Community Improvement Plans

A community improvement plan might combine grant/loan programs for brownfield remediation, public open space, affordable housing, green roofs, and façade improvements with direct municipal initiatives such as street furniture, bike lanes, transit stops, street trees, and bike racks. Combining and targeting these initiatives in priority areas can stimulate redevelopment.
Source: Building Blocks for Sustainable Planning – 10 in a Series of 12: Community Improvement Plans (s. 28) Ministry of Municipal Affairs and Housing © Queen’s Printer for Ontario, 2009. Reproduced with permission.
Chapter 18: Epilogue
- Figure 18.1: Burnaby Social Sustainability Strategy Summary, 2011
- Figure 18.2: Social Housing: Tamura House Hotel Renovation, Vancouver, 2008
- Figure 18.3: Site of a Once-Low-Income Neighbourhood, Calgary, 2007
- Figure 18.4: The Scale of Unmet Housing Needs in Canada
- Figure 18.5: Climate Change in Rankin Inlet, Nunavut
- Figure 18.6: Triangle of Sustainability
- Figure 18.7: Vancouver’s Village at False Creek
- Figure 18.9: Categories of Knowledge Relevant to Planning
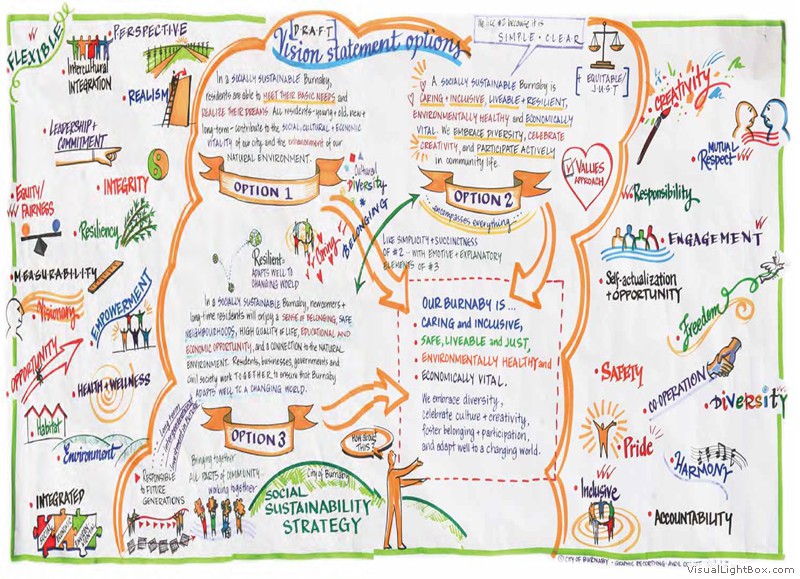
This charming graphic summarizes the main strategies to engage diverse groups in Burnaby, British Columbia. The Burnaby Social Sustainability Plan received the CIP 2012 Social Planning Award.
Source: Avril Orloff/avrilorloff.com
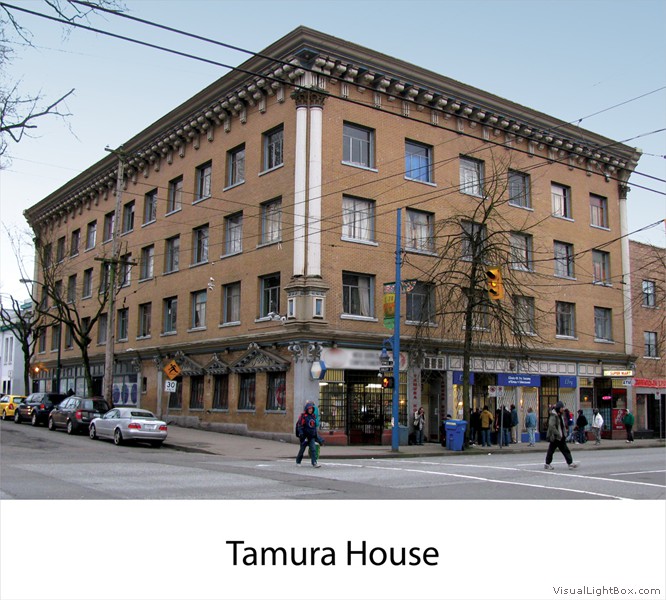
This single-room occupancy (SRO) hotel is being renovated to preserve its role as social housing, which is particularly useful for addressing urban homelessness issues.
Source: BC Housing.
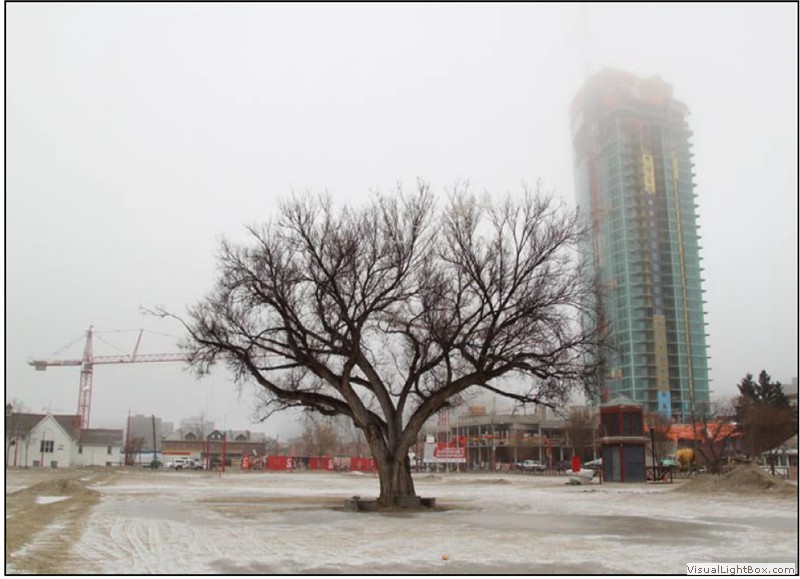
The Victoria Park neighbourhood was razed to provide land to expand the Calgary Stampede Grounds.
Source: Gordon Laird, Shelter: Homelessness in a growth economy: Canada’s 21st century paradox, A Report for the Sheldon Chumir Foundation for Ethics in Leadership, Calgary 2007, figure shown on p. 61. © 2007 Gordon Laird.
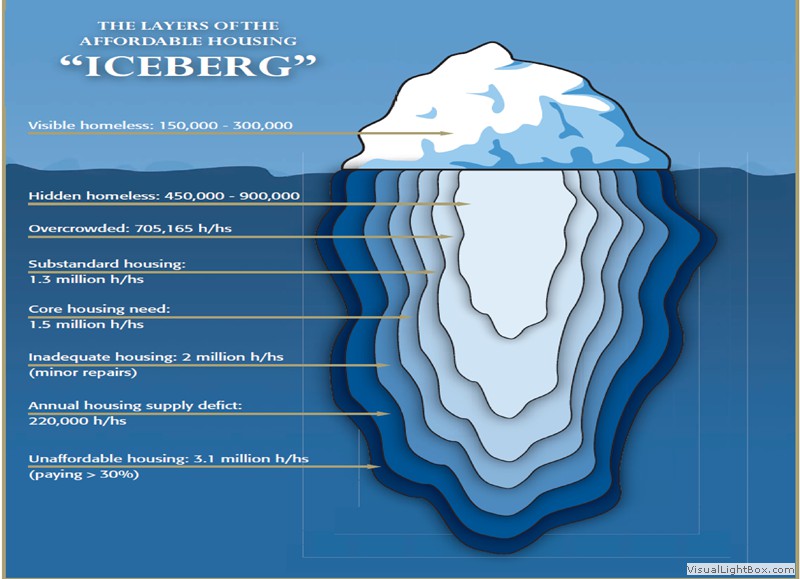
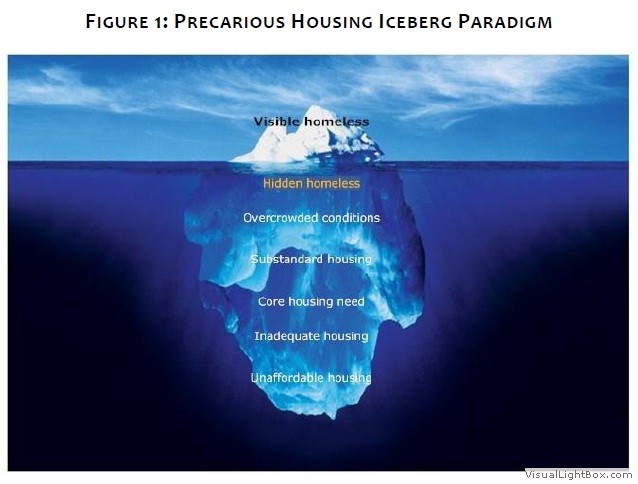
Most of the unmet needs for housing are not readily visible, like the underside of an iceberg.
Source: Wellesley Institute, Precarious Housing in Canada 2010, Figure titled “Layers of the Affordable Housing Iceberg” p. 32.
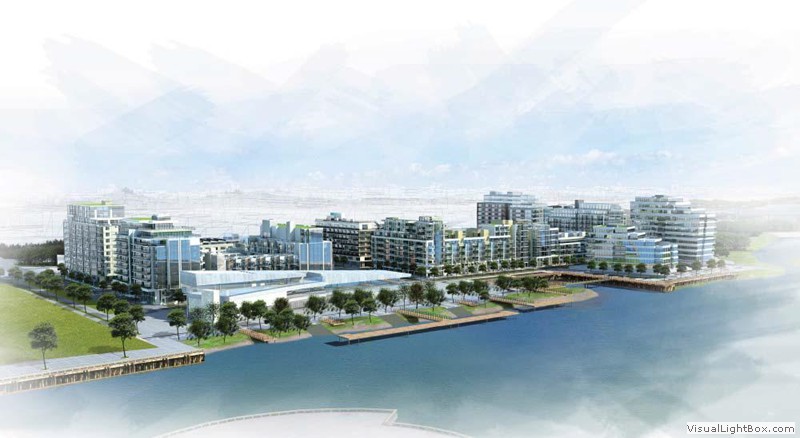
The Village at False Creek (Olympic Village), Vancouver, winner of the 2010 CIP Award for Neighbourhood Planning, was designed as a model of sustainable development. It was certified as LEED Platinum – ‘the greenest community in North America,’ according to the U.S. Green Building Council. However, its developer ran into difficulties after the 2008 financial market meltdown and had to be bailed out by the City of Vancouver, which preserved the environmental and social housing components of the project, even as the market housing costs escalated.
Source: SEFC Properties Ltd.
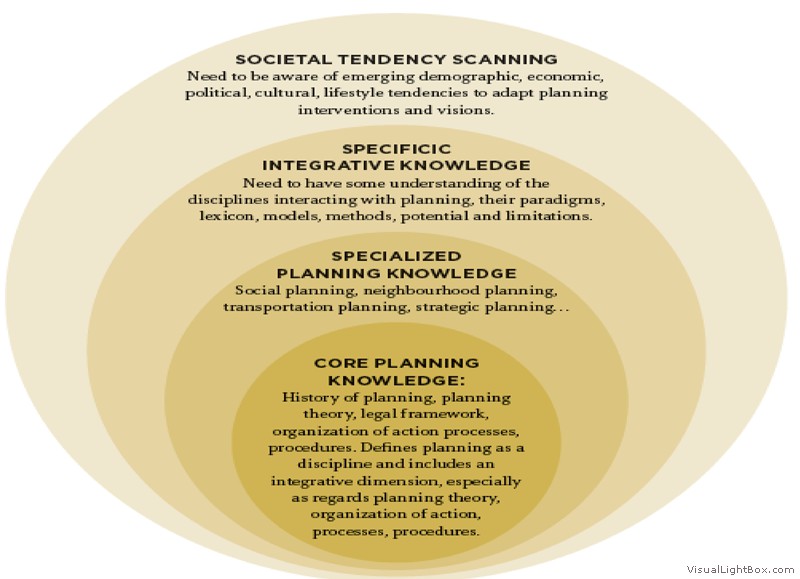
Planners cannot rely only on technically based professional knowledge; they must integrate knowledge from different fields.
Source: Filion, P. 2010, “Renaissance Thinkers for a Fragmented World,” Plan Canada 50 (3): 40 (Figure 1).